Mapping Institutional Liquidity: The Ultimate Guide to the Urovny Indicator
In technical analysis, few concepts hold as much weight as Support And Resistance. Major banks, market makers, and institutional algorithms do not execute trades randomly; they look for historical price clusters and psychological levels to deploy massive block orders. For retail traders, manually identifying and drawing these structural baselines can be tedious and prone to human error. The Urovny indicator—named after the Russian word for "levels"—automates this entire process. It serves as an essential charting utility that dynamically plots critical key levels directly onto your trading interface.
By filtering messy Price Action into clean, horizontal structural boundaries, this indicator gives you an immediate map of where liquidity rests and where the next explosive market move is likely to ignite.
Decoding Dynamic Support and Resistance Channels
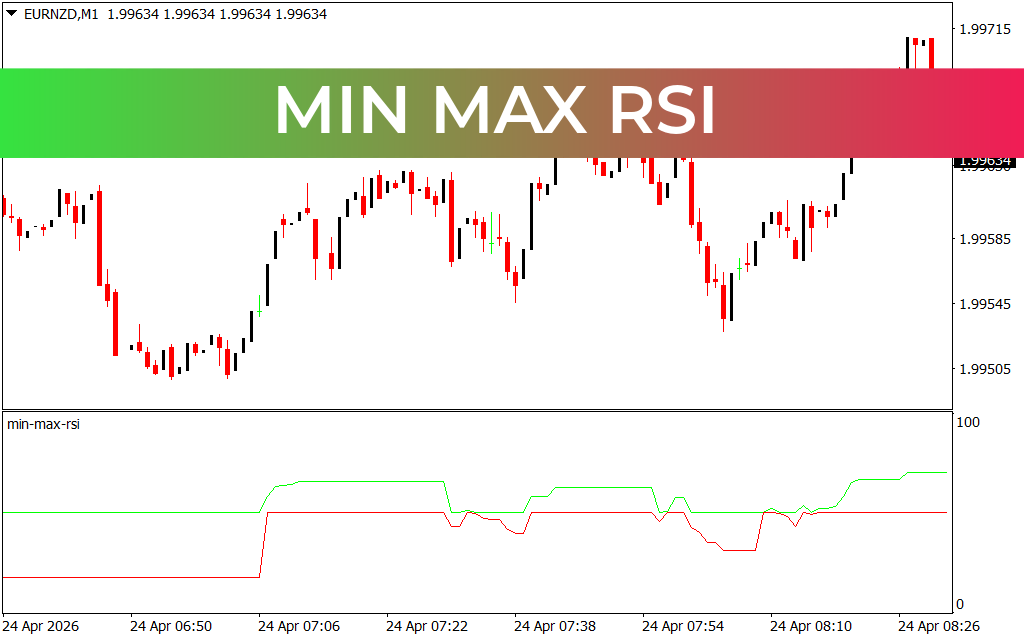
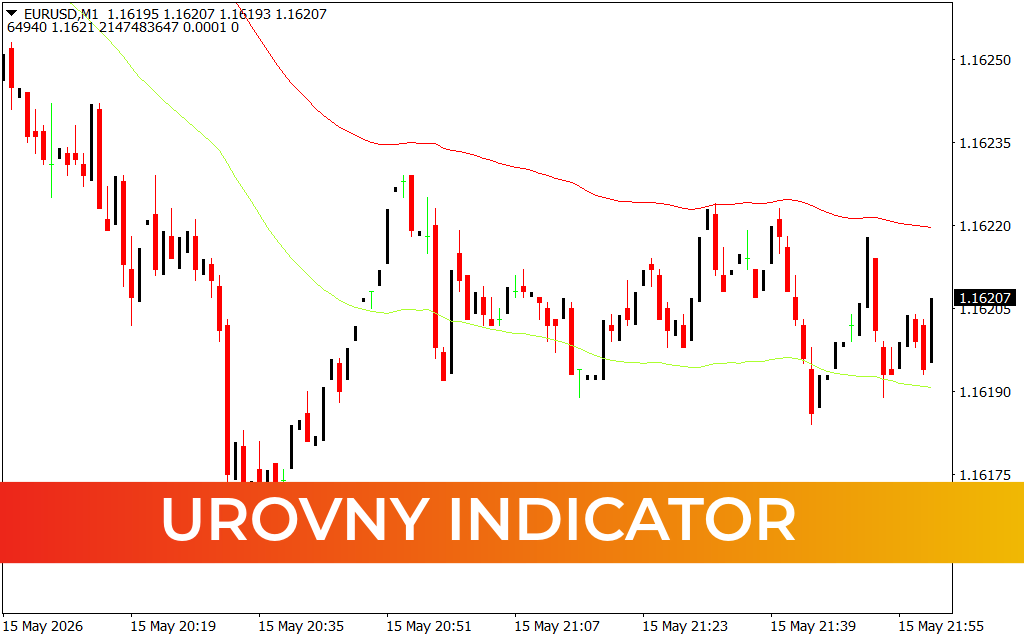
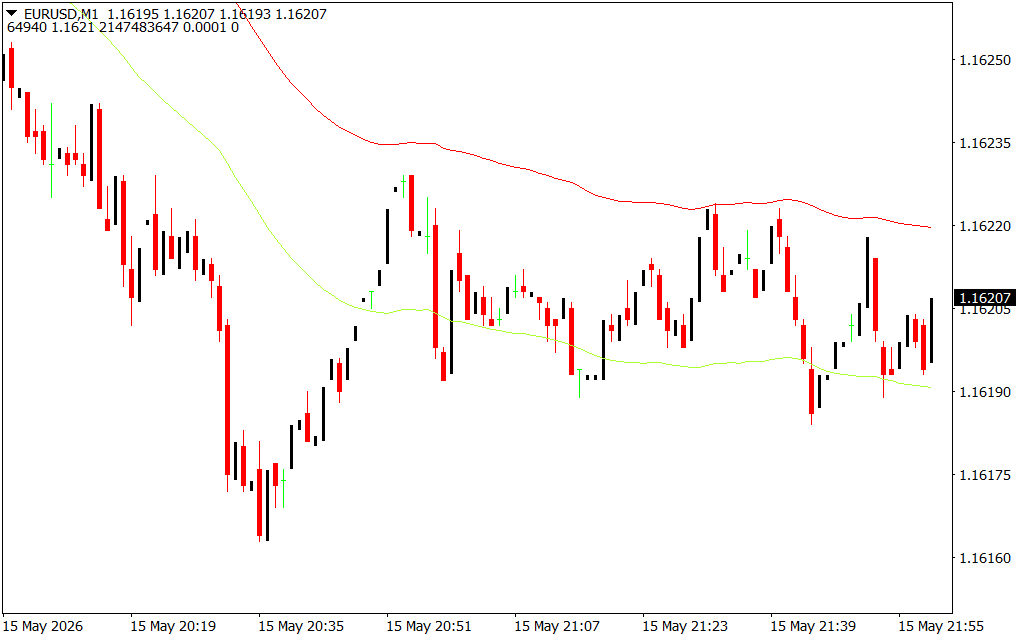
The beauty of the Urovny indicator lies in its visual simplicity and mathematical accuracy. When looking at liquid assets like the EUR/USD on lower timeframes such as the 1-minute (M1) chart, the indicator tracks historical price reactions and automatically draws distinct, color-coded horizontal boundaries:
- The Upper Resistance Ceiling (Red Line): This line locks in significant historical swing highs where selling pressure has previously overwhelmed buyers. As price action approaches this zone, day traders use it as a warning baseline. A failure to break above the red line confirms institutional distribution, offering a high-probability zone to hunt for short setups.
- The Lower Support Floor (Green Line): Operating as the ultimate market safety net, the green line marks deep accumulation zones where big money previously stepped in to drive the price upward. When a currency pair drops into this area and prints rejection candlesticks, it provides a strong technical confirmation to hunt for long entries.
- The Dynamic Moving Average Baselines: Working in harmony with the static support and resistance lines, the indicator incorporates smooth, tracking moving averages (such as the lime green and crimson lines on your screen). These lines help you distinguish between a sideways, range-bound market and an active, high-velocity trend.
Streamlining Breakout and Scalping Strategies
The Urovny indicator is highly versatile, making it an invaluable addition to fast-paced trading styles like 5-minute Scalping or sixty-second micro-trades. It removes subjectivity from your system. Instead of guessing whether a level is valid, you rely on mathematically verified zones that update automatically as new market data develops.
For breakout traders, a definitive candlestick close past the red resistance or green support lines—especially when aligned with the direction of the tracking moving averages—signals a massive surge in institutional volume. Conversely, for mean-reversion traders, these boundaries represent overextended extremes perfect for catching rapid counter-trend corrections. By integrating the Urovny indicator into your MetaTrader platform, you clean up your workspace and ensure your risk management parameters are perfectly aligned with true Market Structure.
3 Downloads
Last Update:
May 17, 2026 16:27 PM
Published:
Jan 20, 2026 16:59 PM
Category: