Master Linear Regression Momentum: VininI Trend LRMA Indicator for MT4
Navigating fast-moving financial markets on short-term horizons like the 15-minute (M15) chart requires clean, unyielding confirmation. For day traders and scalp operators, traditional moving averages or standard trend indicators often deliver lag-heavy information, triggering entries right as a structural expansion runs out of fuel. The VininI Trend LRMA Indicator solves this calculation latency by combining advanced Linear Regression Moving Average (LRMA) logic with clear volume-momentum histograms inside your MetaTrader 4 terminal.
Unveiling the Mathematics of Linear Regression Smoothing
The foundational math behind the VininI Trend LRMA framework shifts away from standard exponential or simple averaging techniques. Instead, it fits a linear regression line across a specified mathematical period, calculating where price should logically value itself based on current velocity. By treating price changes as a continuous vector rather than a jagged sequence of points, it creates an incredibly responsive technical filter.
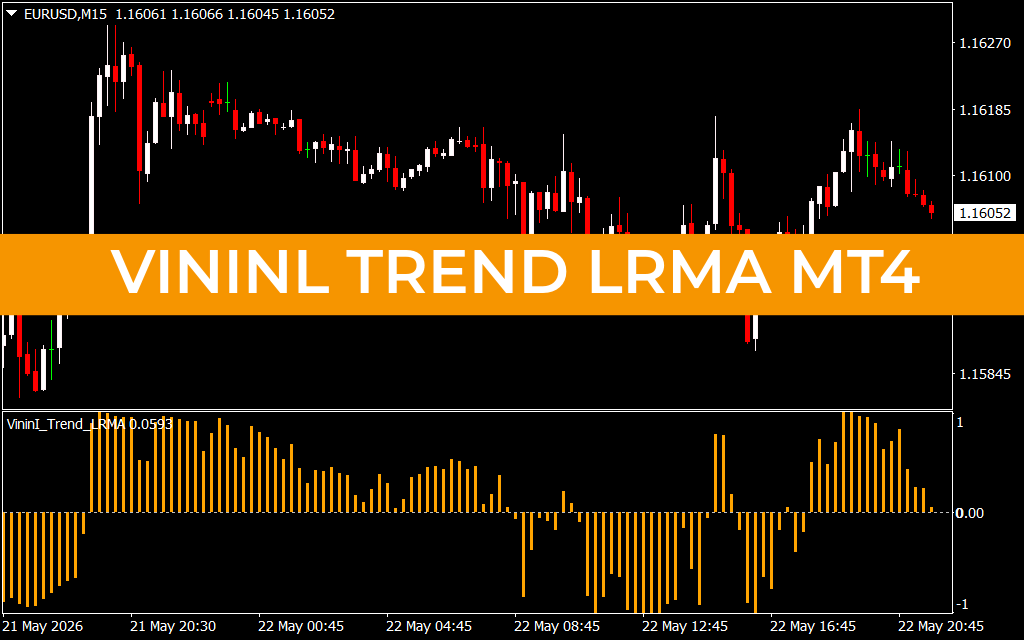
When loaded onto a liquid workspace like the EUR/USD, the tool neatly organizes this data stream into a distinct histogram sub-window:
- Positive Golden Histograms (Above 0.00): Show a mathematically validated bullish expansion phase. The height of each vertical bar represents the accelerating velocity of the current uptrend.
- Negative Golden Histograms (Below 0.00): Signal a confirmed bearish distribution delivery. When bars stack heavily below the zero equilibrium line, it warns you that the immediate path of least resistance is firmly down.
This structural separation lets traders spot structural deceleration long before a physical candlestick prints an actual Trend Reversal on the main chart.
Strategic Execution on the EUR/USD M15 Chart
During liquid market hours, major currency pairs frequently transition between volatile trend legs and horizontal distribution channels. On the M15 workspace, an institutional liquidity sweep can cause the market to shift rapidly, prompting the histogram bars to snap violently across the zero baseline.
Systematic market participants can utilize this binary layout to manage two high-probability trading models:
- Zero-Line Confluence Breakouts: When price clears a consolidation range and the VininI Trend LRMA histogram crosses from negative to positive territory, a powerful bullish expansion leg is confirmed. Traders can execute long positions with high structural confidence.
- Exhaustion Filters for Mean Reversion: If the price prints a fresh minor high but the corresponding histogram bars show a clear pattern of diminishing height, a major momentum divergence is active. This serves as an objective warning to stop buying and prepare for a sharp corrective drop.
Core Architecture Features for Modern Traders
- Digital LRMA Smoothing Core: Dramatically minimizes standard indicator calculation lag, allowing you to catch intraday trend cycles early.
- Clutter-Free Main Screen: Moves complex multi-parameter calculations into a dedicated lower sub-window, keeping your candlestick workspace perfectly clear for order blocks or support levels.
- Objective Signal Mechanics: Provides a clear zero-line crossover boundary, establishing unambiguous rules for mechanical entry execution and trade management.
The VininI Trend LRMA Indicator functions as an analytical shield, cutting through erratic sub-hour market noise to give intraday specialists a clear, data-driven edge.m.
1 Download
Last Update:
May 23, 2026 02:00 AM
Published:
Jan 17, 2026 12:01 PM
Category: