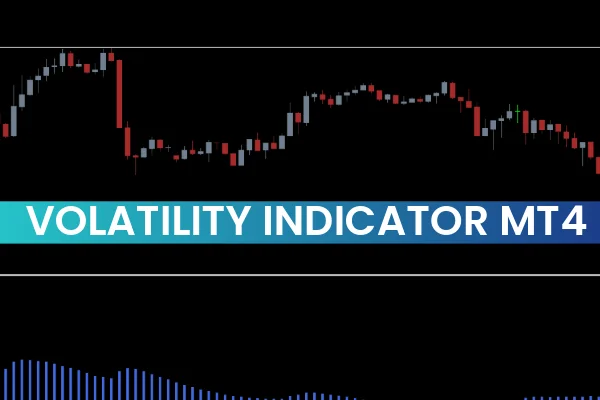
The Volatility Indicator for MT4 is one of the most reliable technical tools for intraday traders and trend-followers. It measures how volatile the Forex market is, helping traders determine whether market conditions are favorable for entering or exiting trades. Since volatility is closely tied to price movement, understanding it is essential for timing entries, avoiding slow markets, and maximizing profit potential.
Understanding Forex Market Volatility
Volatility reflects the speed at which market prices change. When prices move rapidly, volatility is high, offering more trading opportunities. When prices move slowly, volatility is low, often indicating consolidation or weak market conditions.
The Volatility Indicator for MetaTrader 4 helps traders visualize this price behavior by analyzing market activity in real time.
How the Volatility Indicator Works
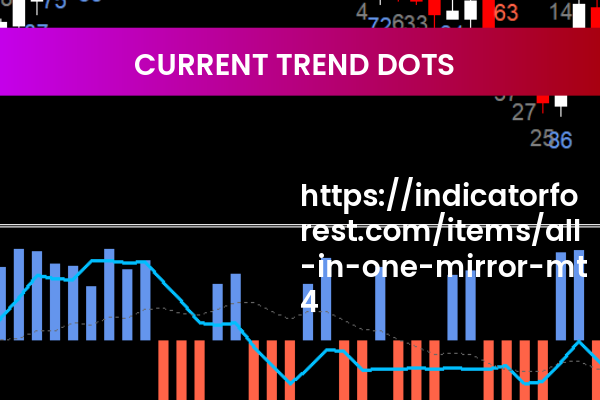
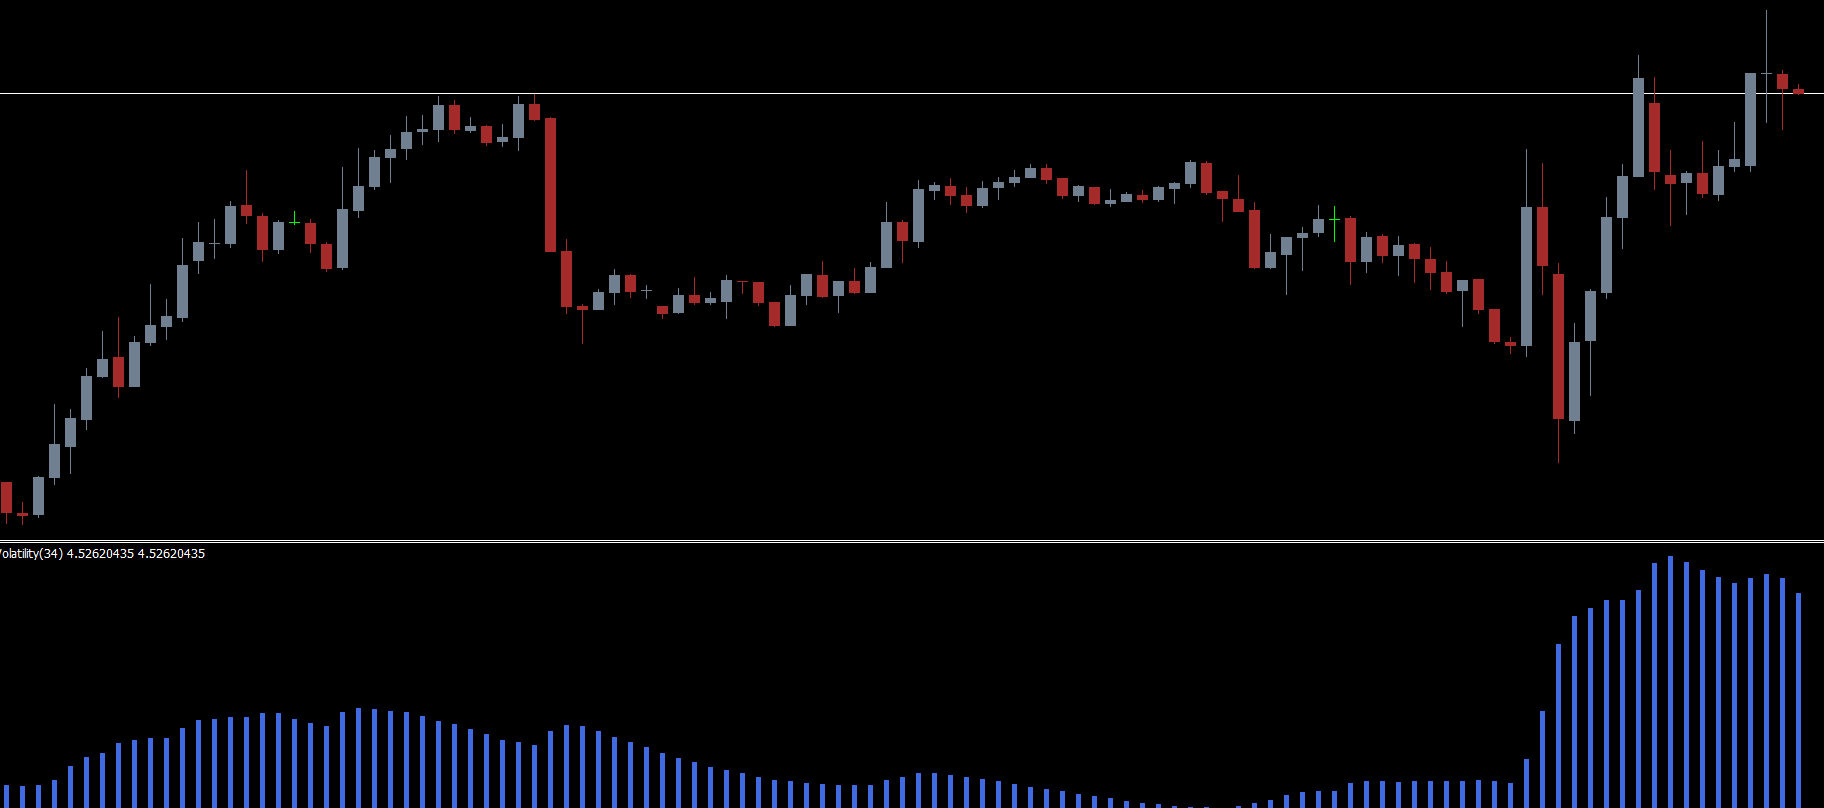
This indicator measures volatility by comparing the Exponential Moving Average (EMA) with market volume, then displays the results as a colored histogram. Each histogram bar represents the current market’s strength and activity:
Royal-blue bars – high volatility
Gray bars – low volatility
The height of the bars indicates whether volatility is increasing or decreasing. As volatility rises, the bars get longer; as volatility weakens, the bars shorten.
This visual format helps traders instantly assess market conditions without complex calculations.
Why Volatility Matters for Traders
Forex traders—especially intraday and trend traders—prefer to trade when volatility is high because strong market activity results in more significant price movements. High volatility increases the potential for profit if the trader’s prediction aligns with the market.
On the other hand, trading in low-volatility environments often leads to:
Small price movements
Slow trade outcomes
Higher spread impact
Increased risk of false breakouts
The Volatility Indicator removes the guesswork by clearly showing when the market is worth trading.
Interpreting the Volatility Indicator BUY/SELL Context
While the indicator does not generate direct BUY or SELL signals, it helps traders decide when to enter trades based on their strategy.
How to Use It for Entries
Identify a valid BUY or SELL setup from your trading strategy.
Check the Volatility Indicator histogram.
Only enter the trade when royal-blue bars start forming, indicating high volatility.
This ensures that your trade occurs during strong market movement.
When to Exit
A trader should consider closing a position when volatility decreases:
Bars begin shrinking
Blue bars shift toward gray
Market momentum weakens
This often signals consolidation or trend exhaustion, making it a strategic time to reduce exposure.
Combining the Indicator With Other Tools
Since this indicator focuses strictly on volatility, it is most effective when paired with technical tools that identify direction and structure, such as:
Trend indicators (Moving Averages, ADX)
Channel indicators (Donchian Channels, Price Channels)
Fractal indicators for entry precision
When layered with these tools, the Volatility Indicator becomes a highly effective component of a professional trading system.
Conclusion
The Volatility Indicator for MT4 is an essential tool for determining whether market conditions are favorable for placing trades. While it doesn’t provide direct BUY or SELL signals, it works as a powerful confirmation tool that helps traders filter out weak markets and execute trades only when volatility is strong.
For the free download and more high-quality Forex trading indicators, visit IndicatorForest.com today.
FAQ
Published:
Nov 26, 2025 11:00 AM
Category: