Master Market Structure with the Urovny Indicator
In the highly technical environment of the Forex and CFD markets, identifying key price levels is the foundation of any successful trading strategy. The Urovny Indicator for MetaTrader 4 is a professional-grade technical tool designed to simplify this process by automatically plotting significant price levels—including support, resistance, and pivot points—directly on your charts. By translating complex historical data into clear, actionable horizontal boundaries, this indicator allows traders to anticipate market reactions with institutional-level precision.
The Power of Automated Price Levels
The word "Urovny" translates to "Levels," and that is exactly what this indicator provides: a structural roadmap for price action. While many retail traders struggle with the subjectivity of drawing manual Support And Resistance lines, the Urovny Indicator uses a consistent mathematical algorithm to identify zones where price has historically stalled or reversed.
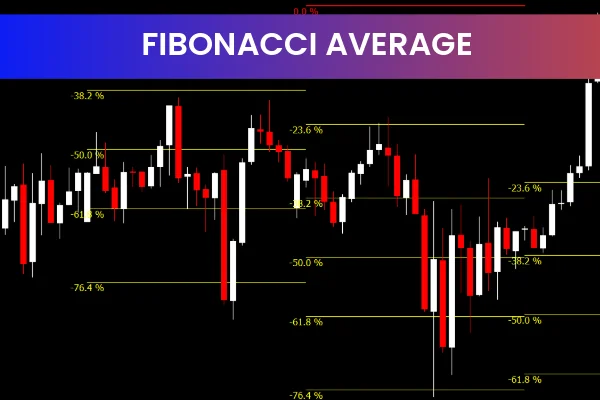
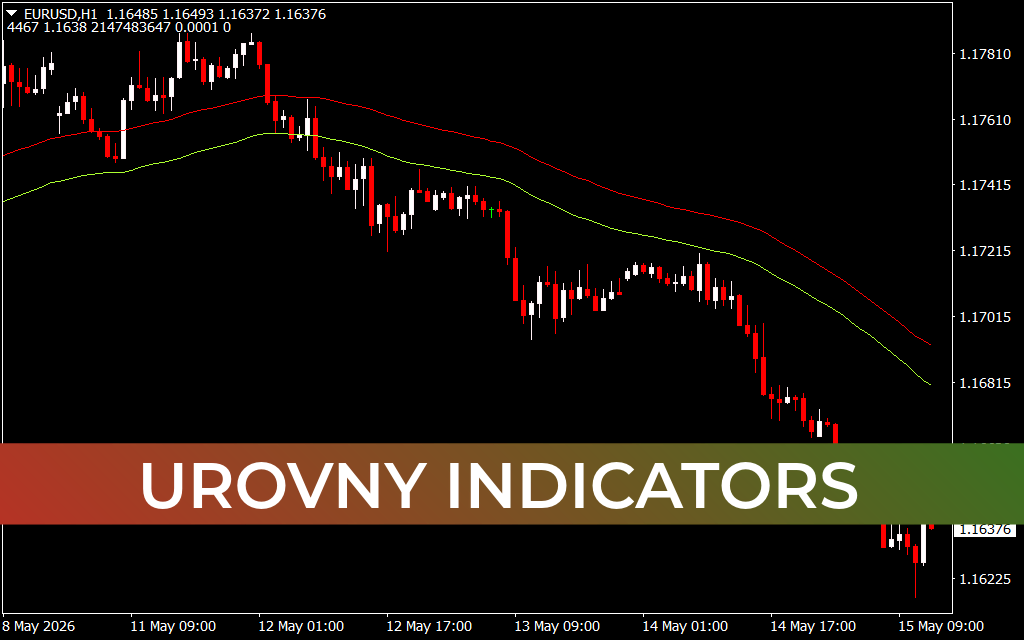
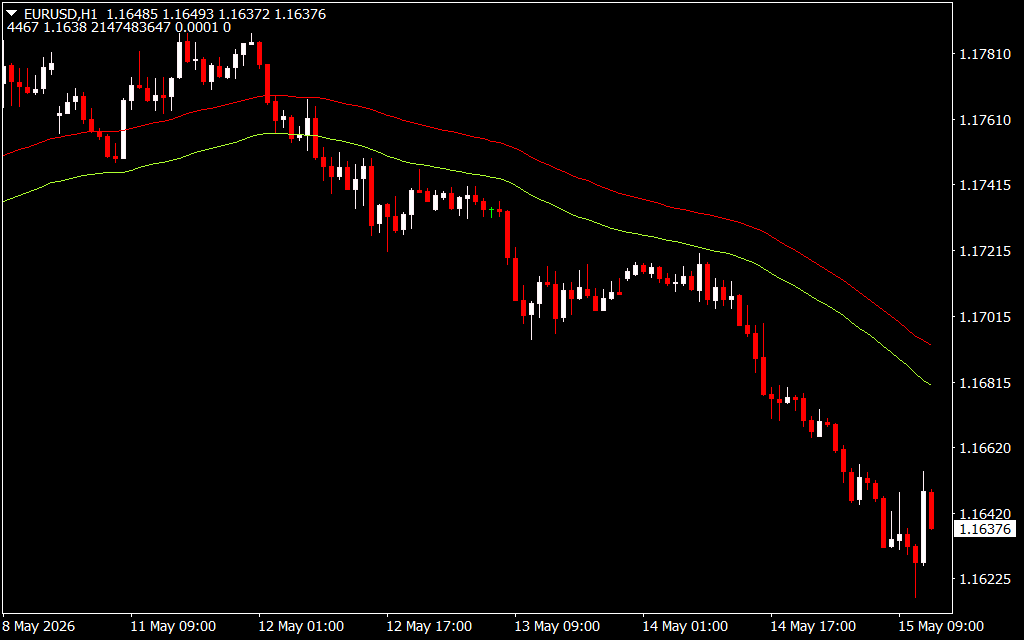
As shown in the EURUSD H1 chart, the indicator typically plots dynamic channels or horizontal lines (often visualized in red and green) that act as the "floor" and "ceiling" of the current market regime.
- Resistance Zones (Red Lines): These represent areas of high supply where sellers have historically regained control. A touch of these levels often precedes a bearish correction or a period of consolidation.
- Support Zones (Green/Yellow Lines): These identify areas of high demand. When price approaches these levels, buyers are likely to enter the market, creating high-probability "buy the dip" opportunities.
Strategic Implementation: Trend Following and Mean Reversion
The Urovny Indicator is a versatile asset that adapts to multiple trading styles, from aggressive Scalping to conservative swing trading.
- Breakout Trading: When price aggressively breaches a major Urovny resistance level with high volume, it signals a potential trend expansion. Traders can use these levels to set entry orders and define clear stop-loss points just on the opposite side of the broken level.
- Range Trading: In sideways markets, the Urovny levels provide the perfect boundaries for mean-reversion strategies. Traders can oscillate between buying at support and selling at resistance with defined mathematical targets.
- Trend Filtering: By observing which Urovny levels are being respected, traders can determine the dominant market bias. In a healthy downtrend, price will consistently fail to breach red resistance levels while creating new, lower support zones.
Why Integration is Essential for MT4 Traders
The primary advantage of the Urovny Indicator is its ability to remove emotional bias from your analysis. By providing objective, pre-calculated levels, it forces a disciplined approach to trade execution.
- Visual Efficiency: The indicator keeps your charts clean and focused on the levels that actually matter for liquidity.
- Universal Application: Whether you are trading the volatile EURUSD, Gold, or major Indices, the logic of Supply And Demand levels remains a constant across all liquid assets.
- Confluence Building: The Urovny Indicator pairs exceptionally well with momentum oscillators like the RSI or MACD. A price touch on a Urovny support level combined with an oversold RSI reading creates a powerful, high-confluence entry signal.
In the modern trading landscape, success is built on understanding Market Structure. The Urovny Indicator provides that structure, giving you the clarity needed to trade with the precision of a professional.
2 Downloads
Last Update:
May 15, 2026 16:34 PM
Published:
Jan 21, 2026 19:56 PM
Category: