Master the Chaos: High-Performance Volatility Trading on MT4
In the modern financial landscape, volatility is often viewed as a risk. However, for the professional trader, volatility is the lifeblood of opportunity. Volatility Trading indicators are designed to quantify market intensity, helping you distinguish between a stagnant range and a high-momentum breakout. When Price Action accelerates, these tools ensure you are positioned to capture the move rather than being caught on the wrong side of a spike.
Decoding the Pulse of the Market
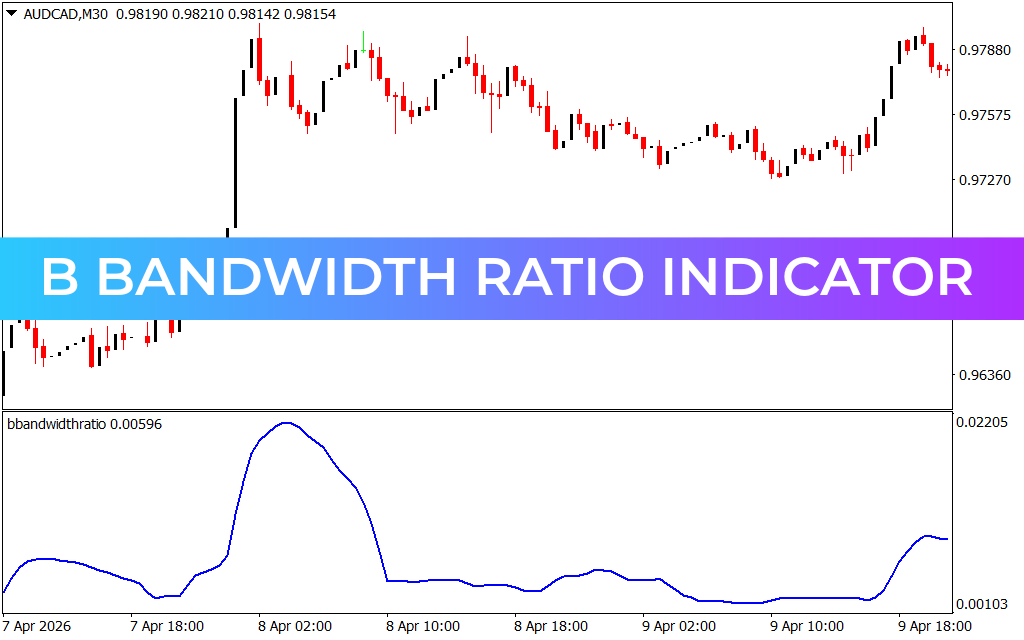
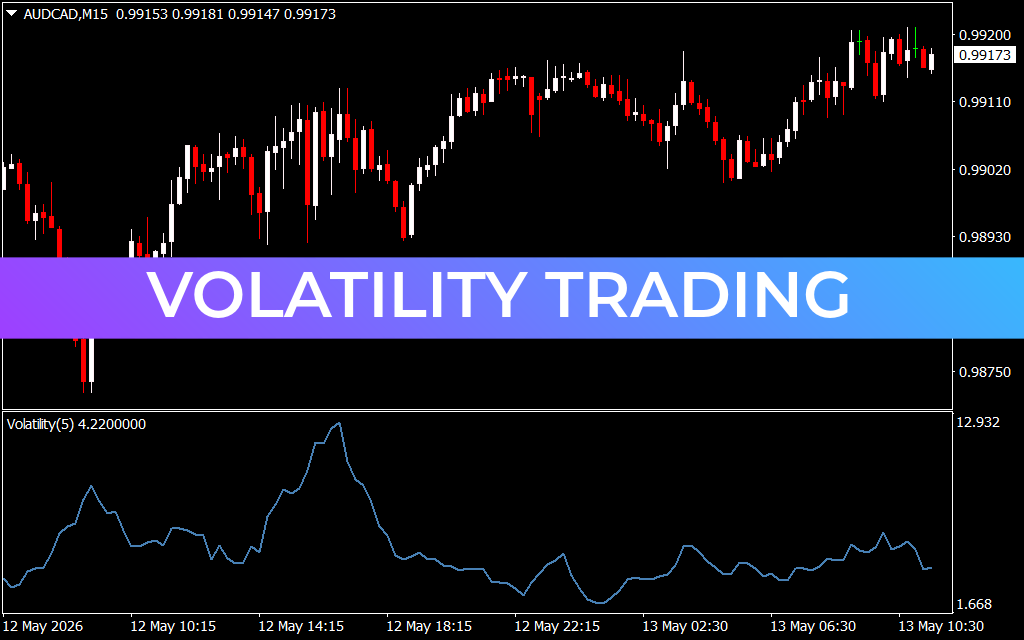
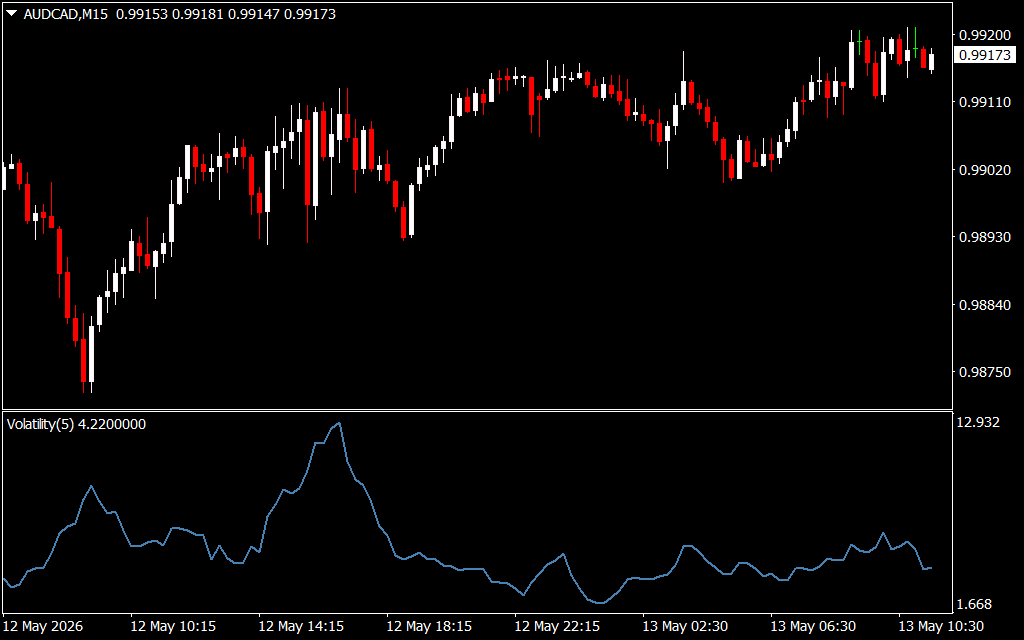
The technical setup on the AUD/CAD M15 chart reveals how critical a volatility-based approach is. While standard price charts show where the price has been, a volatility oscillator—like the one displayed in the sub-window—shows the strength behind those moves. By measuring the rate of change and price deviations, the Volatility Trading tool identifies periods of "market compression" where a breakout is imminent.
As seen on May 12th, the AUD/CAD pair experienced a significant volatility spike early in the session. Traders using this system would have seen the blue oscillator line surge toward the 12.932 level, confirming that the downward move was not a mere flicker but a high-conviction trend. This allows for more precise entries, as you only enter the market when there is enough "fuel" to push the price to your take-profit levels.
Key Benefits of Volatility-Based Strategies
- Breakout Confirmation: Avoid "fakeouts" by ensuring price movement is backed by a rise in relative volatility.
- Dynamic Stop Losses: Adjust your risk based on current market conditions. In high-volatility environments, wider stops are necessary; in low-volatility, tighter stops protect capital.
- Timeframe Versatility: While highly effective for M15 day trading, volatility analysis is essential for scalpers on M1 and swing traders on the H4 charts.
- Objective Analysis: Remove the guesswork. The oscillator provides a clear numerical value (e.g., the current 4.22 reading) to determine if the market is "quiet" or "active."
Strategy Integration: Confluence is King
The best way to utilize the Volatility Trading indicator is in conjunction with price action. In the provided chart, notice how the price consolidated near the 0.99035 level. When the volatility line began to slope upward from its lows, it signaled the end of the consolidation phase. This "quiet before the storm" is where the most profitable trades are born.
By monitoring the peaks and troughs of the volatility line, you can also identify market exhaustion. When volatility hits an extreme high—like the peak seen at 14:15—it often precedes a reversal or a period of sideways movement, signaling that it is time to take profits.
Conclusion
Volatility Trading is about more than just predicting direction; it’s about understanding market energy. For MetaTrader 4 users looking to professionalize their toolkit, integrating a dedicated volatility oscillator is the key to surviving—and thriving—in the 2026 Forex market.
1 Download
Last Update:
May 13, 2026 14:45 PM
Published:
Jan 23, 2026 01:06 AM
Category: