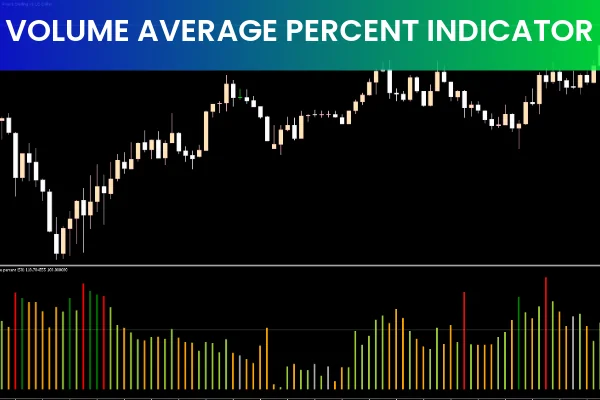
The Volume Average Percent Indicator for MT5 is a simple and effective technical tool that displays trading volume as a percentage relative to a selected period. It uses an Exponential Moving Average (EMA) as the basis of its calculations and plots colored histogram bars in a sub-window beneath the main chart.
Light green, green, orange, and red bars help traders evaluate whether volume is increasing or decreasing—and whether the price movement is supported by strong participation. The indicator is suitable for all types of traders and can be used on any timeframe.
How the Volume Average Percent Indicator Works
The indicator’s histogram bars fluctuate around the 100% level:
Bars above 100% → higher-than-average volume
Bars below 100% → lower-than-average volume
Color Logic
Green bars: High volume during an uptrend
Red bars: High volume during a downtrend
Light green/orange bars: Normal or mid-range volume conditions
When bars extend strongly above the 100% level, it indicates a surge in market activity—usually signaling momentum or possible Trend Reversal conditions.
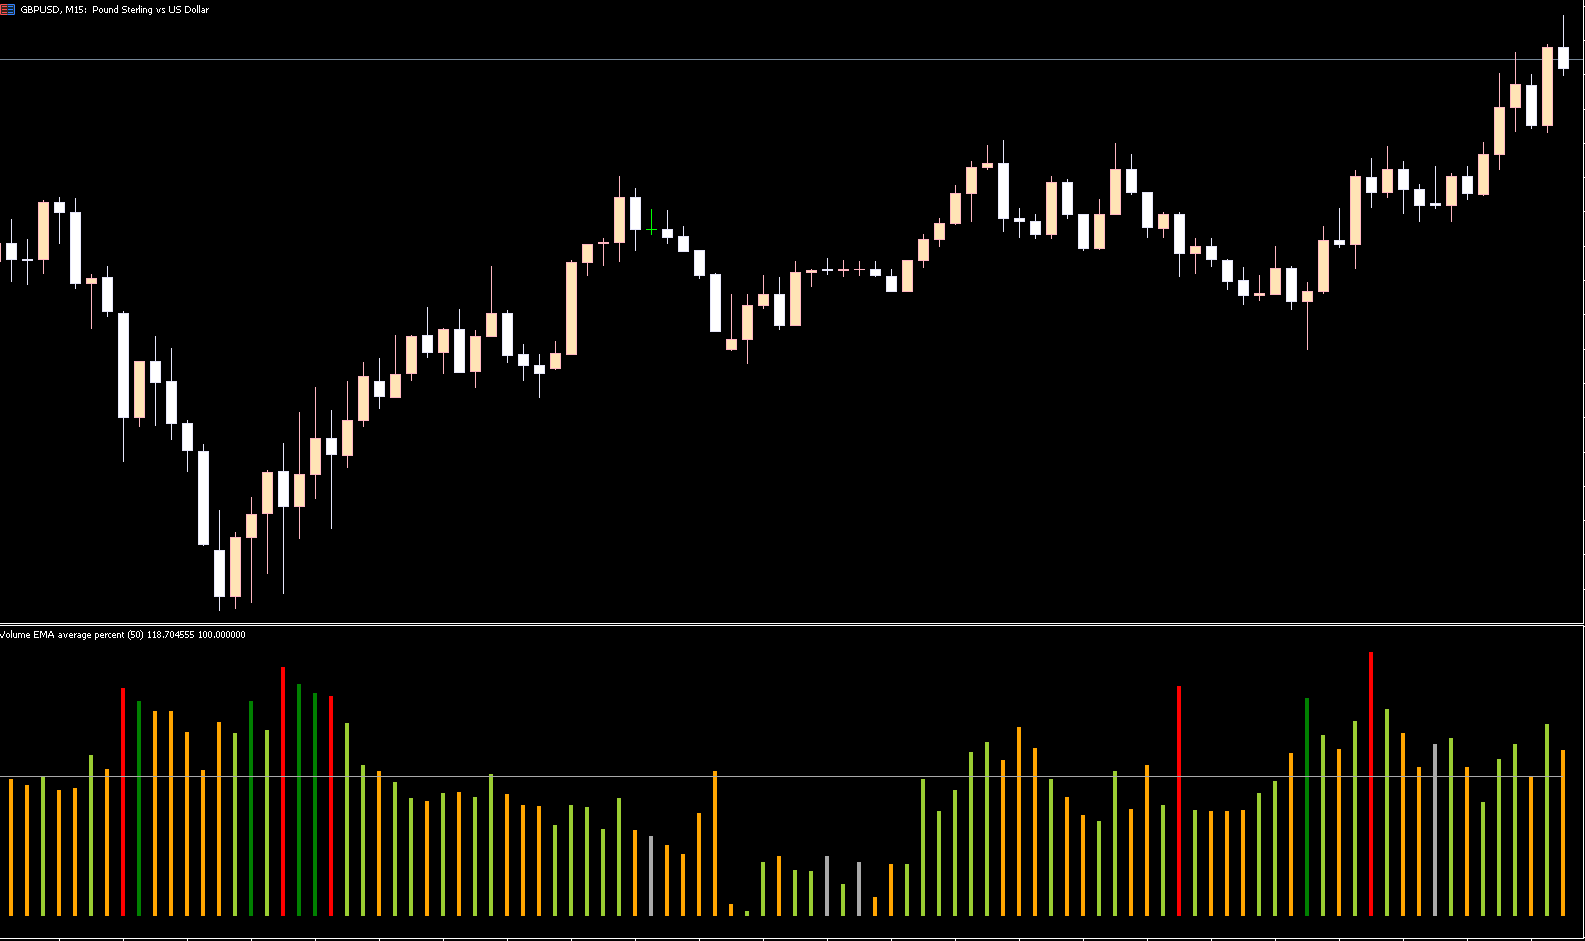
BUY and SELL Signals Using the Volume Average Percent Indicator
The hourly GBP/USD chart example shows how the indicator highlights high-volume activity. Because the indicator measures volume only, traders should determine trend direction independently using price action or a Trend Indicator.
SELL Signal (Short Entry)
A potential short setup occurs when:
Red bars appear above 100%, showing high volume during falling prices
Increased volume suggests strong bearish momentum
Traders may enter short positions once bearish price structure confirms
BUY Signal (Long Entry)
A potential long setup appears when:
Green bars rise above 100%, indicating high volume supporting rising prices
Strong participation increases the reliability of bullish continuation
Traders can go long when price action aligns with the higher volume
Using the Indicator for Reversals
This indicator can also help spot market turning points.
A color change in the histogram often signals weakening prior momentum.
Traders may close long trades when the bars shift from green to red or orange.
Short trades can be exited when red bars fade into green or light green.
Pairing the indicator with oscillators such as RSI, Stochastics, or MACD improves accuracy when identifying reversals.
Conclusion
The Volume Average Percent Indicator for MT5 provides insight into market participation by comparing current trading volume with past averages. Red and green bars highlight high-volume periods that align with bearish or bullish conditions. The indicator is a useful addition to volume-based or momentum-based trading strategies and can be downloaded for free on our website.
FAQ
8 Downloads
Published:
Nov 19, 2025 22:14 PM
Category: