Elevate Your Strategy with the Waddah Attar Weekly Fibo Indicator
Fibonacci retracement and extension levels are cornerstones of technical analysis, used by institutional and retail traders worldwide to project future price targets and hidden reversal zones. However, manually drawing these levels across multiple timeframes every single week can be tedious and prone to human error. To automate and perfect this process, the legendary developer Waddah Attar created a specialized tool for the MetaTrader platform: the Waddah Attar Weekly Fibo Indicator.
By mapping high-tier structural mathematical levels directly onto your lower-timeframe execution charts, this automated utility gives swing traders, day traders, and scalpers an invaluable macro perspective on intraday Price Action.
The Power of Weekly Fibonacci Levels
In technical analysis, higher-timeframe levels carry significantly more psychological and structural weight than intraday levels. The Waddah Attar Weekly Fibo Indicator automatically takes the high, low, and close data of the previous trading week and calculates the most critical retracement ratios for the current week.
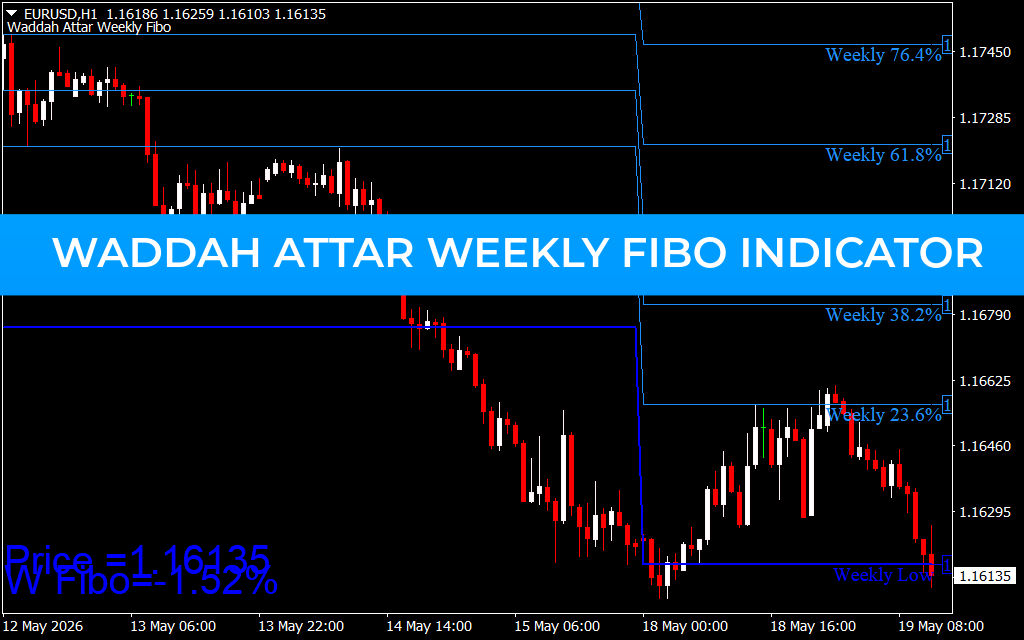
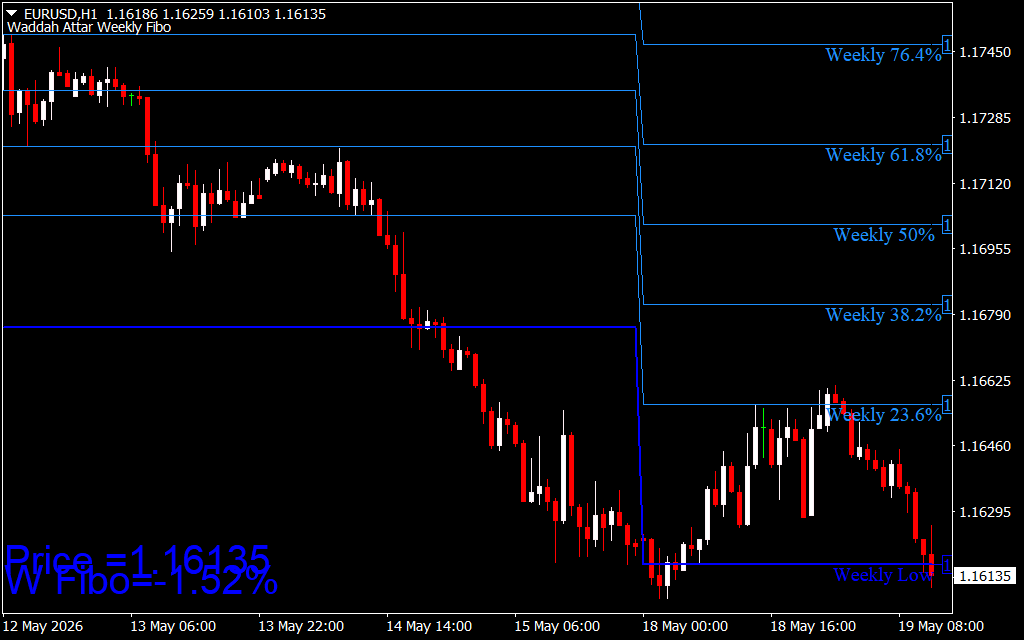
As displayed beautifully on the 1-hour (H1) chart, the tool automatically plots precise horizontal anchor lines including:
- Weekly Low & Weekly High: The absolute boundaries of the prior week's range.
- Core Retracements: Key percentage boundaries including 23.6%, 38.2%, 50.0%, 61.8%, and 76.4%.
When price approaches these specific levels, algorithms and large institutional orders frequently interact, transforming these static lines into highly reliable zones of Support And Resistance.
Advanced Strategic Applications
Integrating an automated weekly Fibonacci map into your MetaTrader workspace unlocks several powerful trading methodologies:
1. Precision Pullback Reversals
During a sustained market markdown or markup, price will rarely move in a straight line. If a currency pair like the EUR/USD is in a dominant downtrend, traders can watch for a corrective rally into a major level, such as the Weekly 23.6% or 38.2% lines. A bearish candlestick rejection pattern at these pre-calculated zones offers an excellent, low-risk short entry aligned with macro momentum.
2. Clear Take-Profit and Target Mapping
Finding where to exit a profitable position is often harder than finding the entry. The Waddah Attar Weekly Fibo Indicator acts as an automated target map. If you buy near the Weekly Low, the horizontal lines above serve as natural, highly accurate take-profit targets.
3. Real-Time Percentage Tracking
The indicator features an on-screen data readout (e.g., "W Fibo = -1.52%") that updates in real time. This immediate statistical metric informs you exactly where the current price sits relative to the weekly structure, letting you know instantly if the market is extended or consolidating.
Streamline Your Workflow Today
The Waddah Attar Weekly Fibo Indicator is an essential asset for any level-based trader looking to eliminate subjectivity from their charts. By ensuring your daily and intraday execution strategies remain anchored to key weekly market structures, this indicator provides the data-driven precision required to successfully navigate today's volatile financial markets.
2 Downloads
Last Update:
May 19, 2026 15:47 PM
Published:
Jan 19, 2026 20:00 PM
Category: