Precision Price Action Analysis with the Wajdyss RSI OHLC Indicator
The Relative Strength Index (RSI) is globally recognized as the gold standard for measuring momentum and identifying overbought or oversold market conditions. However, standard RSI displays can often feel detached from actual Price Action, as they only plot a single line based on closing prices. The Wajdyss RSI OHLC Indicator for MetaTrader 4 (MT4) revolutionizes this classic oscillator by incorporating Open, High, Low, and Close (OHLC) data directly into the RSI calculation, providing a comprehensive "candle-style" view of momentum.
The Evolution of Momentum Visualization
Traditional RSI calculations can be misleading during periods of high volatility or significant price wicks, as they ignore the price movement that occurred within the candle's duration. The Wajdyss RSI OHLC addresses this by calculating RSI values for each of the four price points. This creates an RSI "candle" or histogram that mirrors the actual price action of the main chart.
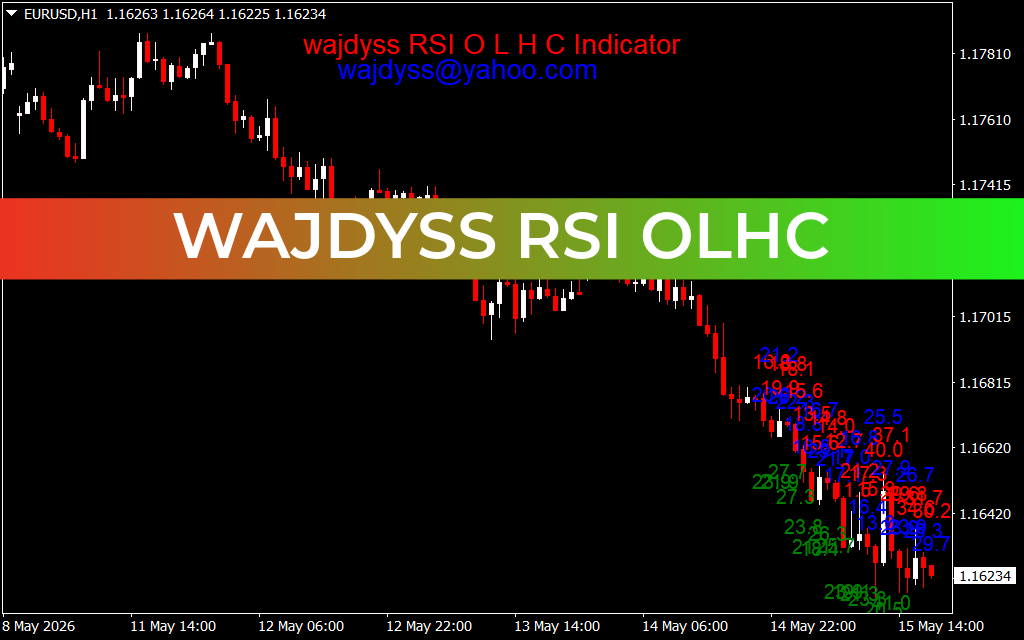
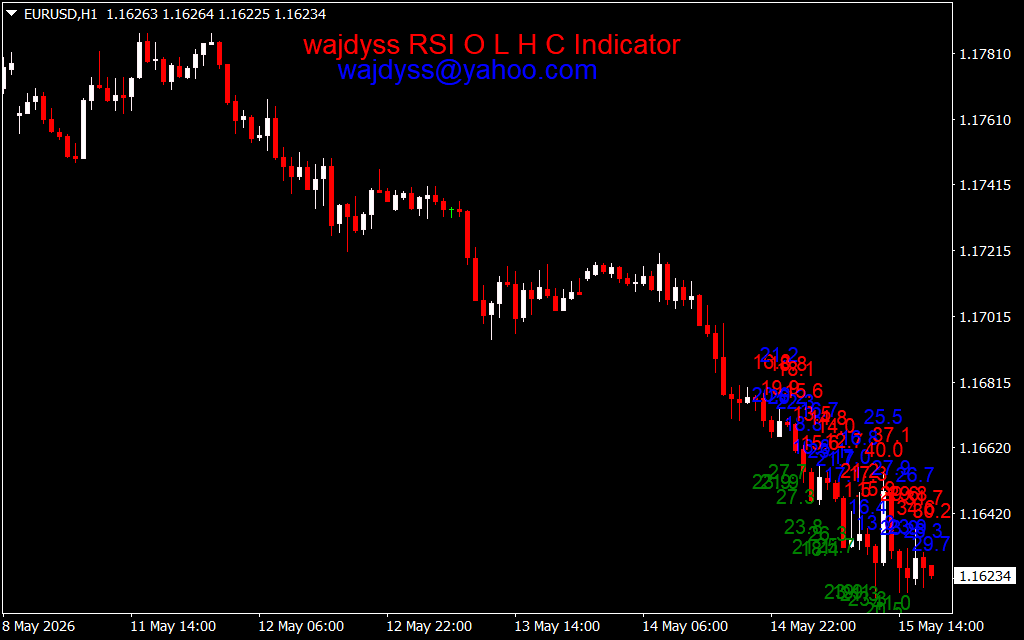
As seen in the EURUSD H1 technical dashboard, the indicator is visualized in a sub-window with a clear color-coded system:
- Green Bars/Candles: Represent bullish momentum where the RSI "close" is higher than the "open," indicating strong buying pressure.
- Red Bars/Candles: Indicate bearish momentum where the RSI "close" is lower than the "open," signaling dominant selling interest.
- Wick Analysis: The "shadows" on the RSI candles show the extreme momentum reaches (highs and lows) during the period, highlighting potential exhaustion before it becomes evident on the price chart.
Strategic Trading: Divergence and Zone Transitions
The Wajdyss RSI OHLC is a powerhouse for traders who specialize in price action and mean-reversion strategies. By providing a more granular look at momentum, it allows for more precise entries than a standard line oscillator.
- Momentum Crossovers: Traders often look for the RSI OHLC to cross above or below a median line (typically the 50 level). A green candle forming above 50 is a high-probability signal that a bullish trend is gaining structural integrity.
- Advanced Divergence Detection: Because the indicator includes High and Low data, traders can spot "internal" divergences. If the price makes a new high but the RSI OHLC "High" wick is lower than the previous peak, it serves as a leading warning of an imminent reversal.
- Overextended Exhaustion: When the RSI OHLC candles reach the extreme 70 (Overbought) or 30 (Oversold) zones, the presence of long RSI wicks can signal that the market is struggling to maintain its trajectory, providing an early cue to take profits or tighten stop-losses.
Why Professional Traders Choose Wajdyss RSI OHLC
In the modern trading environment, having a "multidimensional" view of the market is essential. The Wajdyss RSI OHLC provides exactly that by merging momentum analysis with price action geometry.
- Enhanced Clarity: It removes the "flatness" of traditional RSI lines, making it easier to visualize the intensity of buying and selling within each timeframe.
- Multi-Asset Utility: Whether you are trading Forex majors, volatile Crypto pairs, or Indices, the OHLC-based logic provides a robust measure of market conviction.
- Customizable Parameters: Traders can adjust the RSI period to suit their style, from ultra-fast M1 Scalping to conservative Daily swing trading.
By integrating the Wajdyss RSI OHLC Indicator into your MT4 setup, you gain a professional edge in understanding the true strength of price moves. Stop trading half the story and start seeing the full momentum of the market. today.
1 Download
Last Update:
May 15, 2026 21:08 PM
Published:
Jan 21, 2026 18:03 PM
Category: