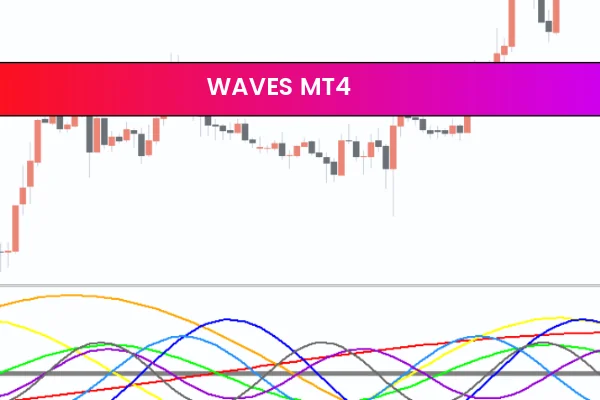
The Waves Indicator is a powerful analytical tool designed to help traders understand price cycles and market fluctuations across multiple timeframes. By visualizing several overlapping waveforms, it provides a multi-dimensional view of market dynamics. Each waveform represents a unique market cycle, helping traders detect potential turning points, emerging trends, and rhythm patterns that influence asset prices.
Unlike traditional indicators that simply track linear price movements, the Waves Indicator focuses on cyclical price behavior, making it invaluable for traders who use Elliott Wave Theory, cycle analysis, or advanced timing techniques. Whether you trade forex, stocks, crypto, or commodities, this indicator enhances your ability to spot market reversals and trend continuations with clarity.
How the Waves Indicator Works
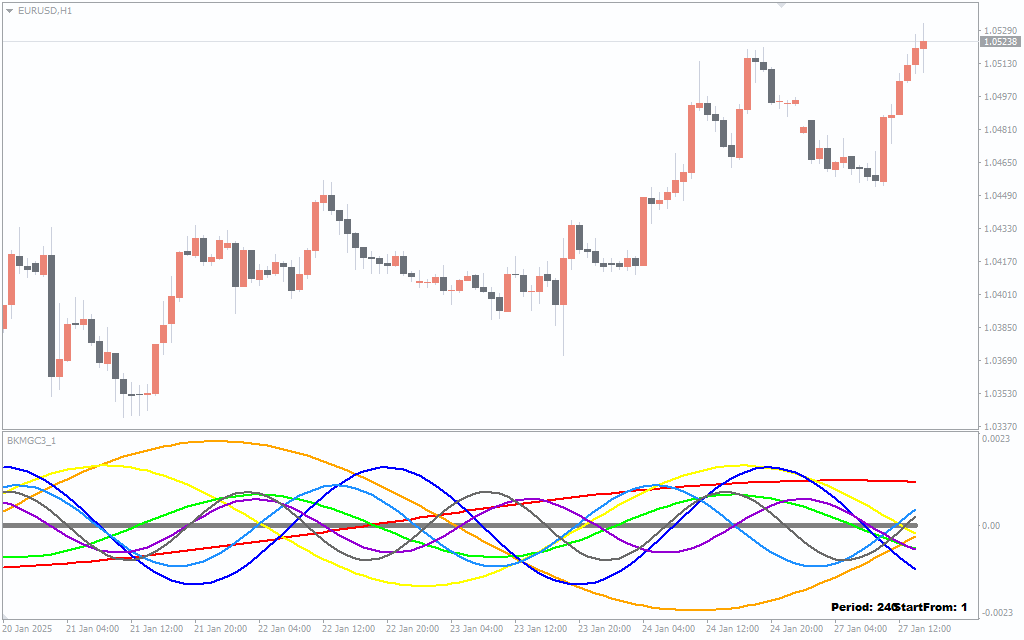
The Waves Indicator uses a series of color-coded waveforms to visualize different market cycles simultaneously. These can range from short-term intraday fluctuations to long-term macroeconomic cycles, giving traders a comprehensive perspective on price rhythm and momentum.
H3: Wave Alignment – Identifying Strong Trends
When multiple waves move in the same direction, it indicates a strong trend is forming.
Upward alignment of waves signals a bullish market.
Downward alignment suggests bearish conditions.
This alignment helps traders enter trades confidently in the direction of dominant momentum.
H3: Wave Convergence – Spotting Reversals
When several waves converge or cross at a single point, it marks a potential reversal zone.
This can signal high-probability entry or exit points, ideal for swing traders and position traders.
By paying attention to these convergence zones, traders can anticipate turning points before the rest of the market reacts.
Diverging Waves – Reading Market Volatility
When waves diverge (move apart), it indicates rising volatility and potential trend exhaustion.
This can be an early warning that a strong move is losing momentum, prompting traders to tighten stop-losses or take partial profits.
Rhythm and Cycle Analysis
Every market has its natural rhythm, influenced by trader psychology, liquidity, and macroeconomic cycles.
The Waves Indicator captures this rhythm visually, helping traders time their entries and manage trades with precision.
Recognizing these recurring cycles allows traders to optimize strategy performance across multiple time horizons.
Why Traders Choose the Waves Indicator
The Waves Indicator stands out because it goes beyond simple trend-following. It helps traders understand how trends form, mature, and end.
Some of its main benefits include:
Enhanced Market Timing – Identify ideal entry and exit points.
Multi-Cycle Visualization – See both short-term and long-term trends together.
Compatibility – Works with most major trading platforms and assets.
Advanced Signal Interpretation – Integrates seamlessly with Elliott Wave, MACD, or RSI analysis.
Traders using the Waves Indicator report greater confidence in decision-making and reduced emotional bias, especially when trading volatile instruments.
How to Use the Waves Indicator in Your Strategy
Incorporating the Waves Indicator into your trading strategy is straightforward:
Load the indicator on your preferred charting platform.
Observe wave alignments to confirm the trend direction.
Look for convergence points to identify possible reversals.
Combine with other tools like moving averages or support/resistance zones for confirmation.
Always apply sound risk management—no indicator replaces discipline.
Final Thoughts
The Waves Indicator is an essential tool for any trader looking to decode market cycles and trade with precision. By visualizing how price movements align, diverge, and repeat over time, traders gain a deep understanding of market rhythm.
Whether you are a day trader seeking intraday reversals or a long-term investor identifying macro trends, the Waves Indicator provides clarity, structure, and timing advantage.
👉 Visit IndicatorForest.com today to explore more powerful tools and enhance your trading strategy.
1 Download
Published:
Dec 28, 2025 14:37 PM
Category: