In the fast-paced world of Forex trading, understanding market patterns can give traders a significant edge. The WD Gann Box Indicator is a free and powerful MT4 tool designed to reveal hidden insights within price movements, helping traders make more informed decisions. By using this indicator, traders can anticipate market movements, identify key levels, and improve trade timing.

How the WD Gann Box Indicator Works
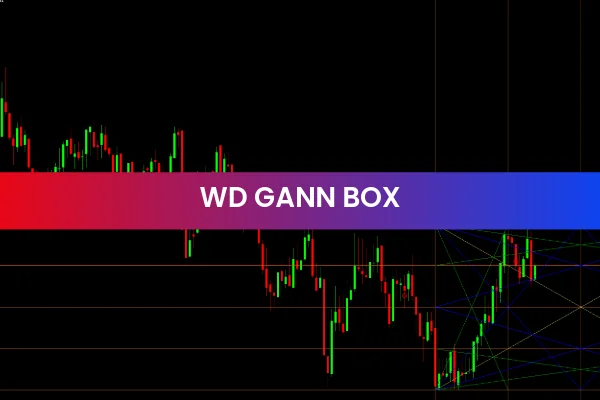
The WD Gann Box Indicator is based on W.D. Gann’s Square of Nine theory, a long-standing analytical framework that connects price, time, and market cycles. The indicator automatically plots a series of boxes on the chart, each representing a specific price range derived from Gann’s principles.
These boxes act as visual guides for identifying Support And Resistance zones. When price interacts with a box boundary, it can signal potential areas for market reversal or continuation. The indicator also highlights possible buy and sell zones, giving traders actionable insights without relying on complex manual calculations.
Key Features of the WD Gann Box Indicator
The WD Gann Box Indicator includes several features that make it an essential tool for Forex traders:
Plots Gann-based boxes to visualize price ranges
Identifies critical support and resistance levels
Highlights potential buy and sell zones
Works on all MT4 timeframes and currency pairs
Free and easy to install on MT4
Suitable for Scalping, day trading, and swing trading
Automatically adjusts boxes based on market price movements
These features provide traders with a clear visual framework to analyze Market Structure and anticipate price action effectively.
Benefits of Using the WD Gann Box Indicator
The main benefit of the WD Gann Box Indicator is its ability to translate complex Gann theories into actionable trading signals. By visually representing price ranges and market cycles, the indicator helps traders:
Time their entries and exits more accurately
Identify strong support and resistance zones
Anticipate potential market reversals or continuations
Enhance trading decisions for both short-term and long-term strategies
The indicator is particularly valuable for traders who want to integrate historical price patterns and market geometry into their technical analysis.
How Traders Can Use the Indicator Effectively
To use the WD Gann Box Indicator effectively:
Observe how price interacts with box boundaries to anticipate reversals
Combine box signals with other tools, such as moving averages or oscillators, for confirmation
Use the boxes to plan stop-loss and take-profit levels
Apply the indicator across multiple timeframes to understand short-term and long-term trends
This approach ensures trades are based on a combination of market geometry, support/resistance, and timing, improving overall profitability.
Why the WD Gann Box Indicator Is Popular
The WD Gann Box Indicator remains popular because it simplifies the application of Gann’s complex market theories, offering a practical way to visualize key price levels. Traders of all experience levels can use it to gain a deeper understanding of market structure, identify trading opportunities, and execute trades with more confidence.
Overall, the WD Gann Box Indicator is a valuable MT4 tool for traders seeking to enhance market analysis, improve timing, and maximize potential profits.
Explore the WD Gann Box Indicator today. Visit IndicatorForest.com to download this free MT4 indicator and discover more professional tools for smarter Forex trading.
FAQ
It applies W.D. Gann’s Square of Nine principles to draw structured boxes that mark important price and time levels. These boxes highlight potential support, resistance and turning zones.
Watch how price reacts at box boundaries: strong rejections can signal reversals, while clean breaks can suggest continuations or breakouts. Combining these reactions with other indicators improves trade selection.
Yes, it can be scaled to different timeframes, though higher charts tend to show more meaningful structure. Lower timeframes can then be used to fine‑tune entries near important box levels.
No. The indicator handles the complex calculations for you. Having a basic idea that boxes represent geometric support and resistance is usually enough to apply it practically.
Trend analysis, candlestick signals and volume or momentum tools help confirm whether reactions at box levels are strong enough to trade.
23 Downloads
Published:
Dec 18, 2025 00:55 AM
Category: