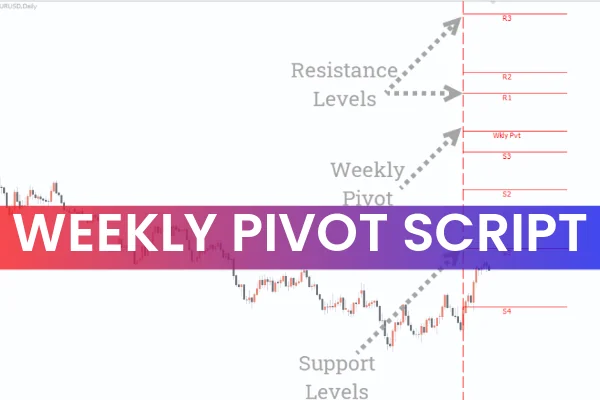
The Weekly Pivot Script for MT4 is an essential tool for traders who want to identify key levels of support and resistance. The market often reacts to previous reversal points, and pivot points help determine these critical areas.
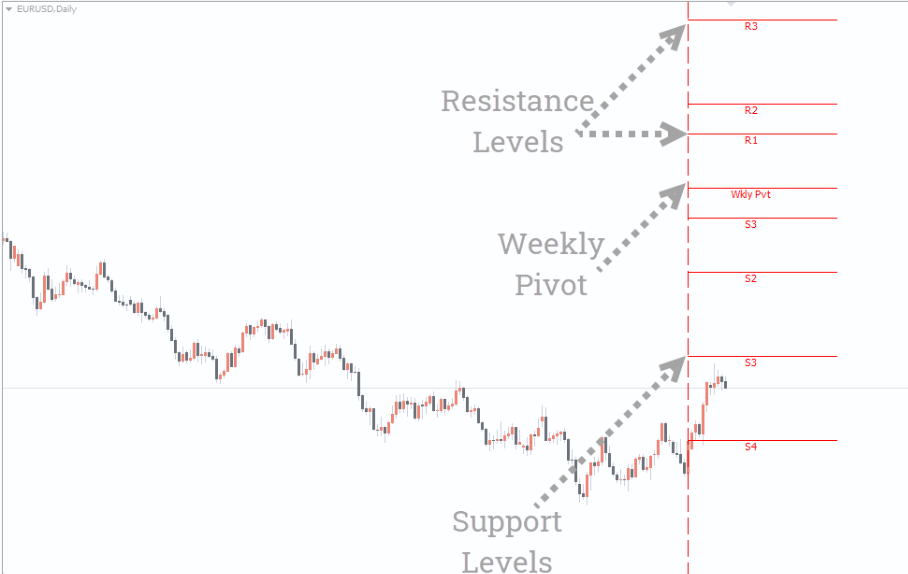
The script calculates the weekly pivot using the average of the previous week’s high, low, and close. Additionally, it plots six Support And Resistance levels, providing a clear framework for trading decisions.
How It Works
The script automatically:
Calculates the pivot point from the previous week’s high, low, and close.
Plots six resistance (R1-R6) and support (S1-S6) levels on the chart.
Highlights key areas where price is likely to react, reverse, or continue its trend.
Traders can use these levels to anticipate market reversals or Trend Continuation. For example, if price approaches a resistance level from below, be prepared for a potential downward reversal. Conversely, when price hits a support level, watch for upward retracement or trend continuation.
Practical Applications
The Weekly Pivot Script is useful for:
Swing traders: Identify key weekly reversal points for optimal entry.
Intraday traders: Use pivot levels as dynamic support and resistance during daily sessions.
Confirmation of candlestick patterns: Combine pivot levels with signals such as Doji or Morning Star for precise entries.
Market trend evaluation: Quickly assess whether the market respects pivot points for ongoing trend analysis.
For instance, if EUR/USD retraces to the weekly pivot and forms a Doji candle, traders can anticipate a continuation of the previous uptrend and plan their entries accordingly.
Benefits of Using the Script
Clear Market Structure: Easily identify pivot, support, and resistance levels.
Improves decision-making: Spot potential reversals or continuation zones.
Combines with candlestick analysis: Enhances precision using reversal patterns.
Time-saving: Automatically calculates weekly pivots and plots levels.
Free download: Available at IndicatorForest.com.
This script is ideal for traders looking to align trades with key market memory points and improve entry timing.
Conclusion
The Weekly Pivot Script for MT4 is a top tool for identifying significant levels of interest in the market. By combining pivot points with support and resistance levels, traders can anticipate potential reversals or trend continuation. Use candlestick patterns like Doji or Morning Star to confirm entries and trade in the direction of the initial trend. Download the script for free at IndicatorForest.com to enhance your weekly market analysis.
FAQ
2 Downloads
Published:
Dec 03, 2025 03:16 AM
Category: