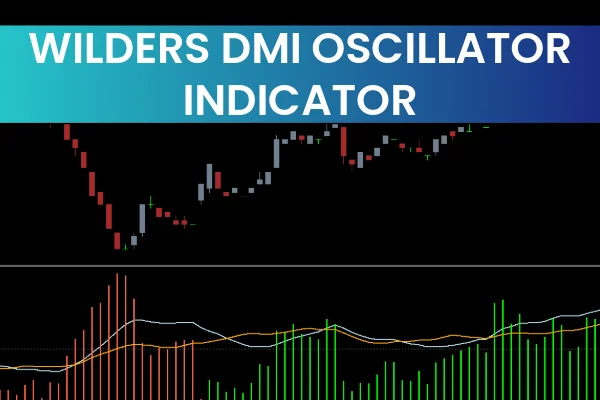
The Wilders DMI Oscillator for MT4 is a versatile indicator designed to measure Trend Strength and direction in the market. By displaying two directional lines and a histogram, it allows traders to quickly understand whether the price momentum is bullish or bearish and when the trend is strong enough to enter trades.
The indicator consists of:
+DI (light blue line): Shows upward price momentum.
-DI (orange line): Shows downward price momentum.
Histogram: Reflects trend strength and volatility, helping traders identify strong trends.
This oscillator is ideal for both novice and experienced traders and works on any timeframe, making it suitable for intraday, daily, and long-term strategies.
At IndicatorForest.com, you can download the Wilders DMI Oscillator for MT4 for free and start identifying high-probability trend trades.
How Wilders DMI Oscillator Works
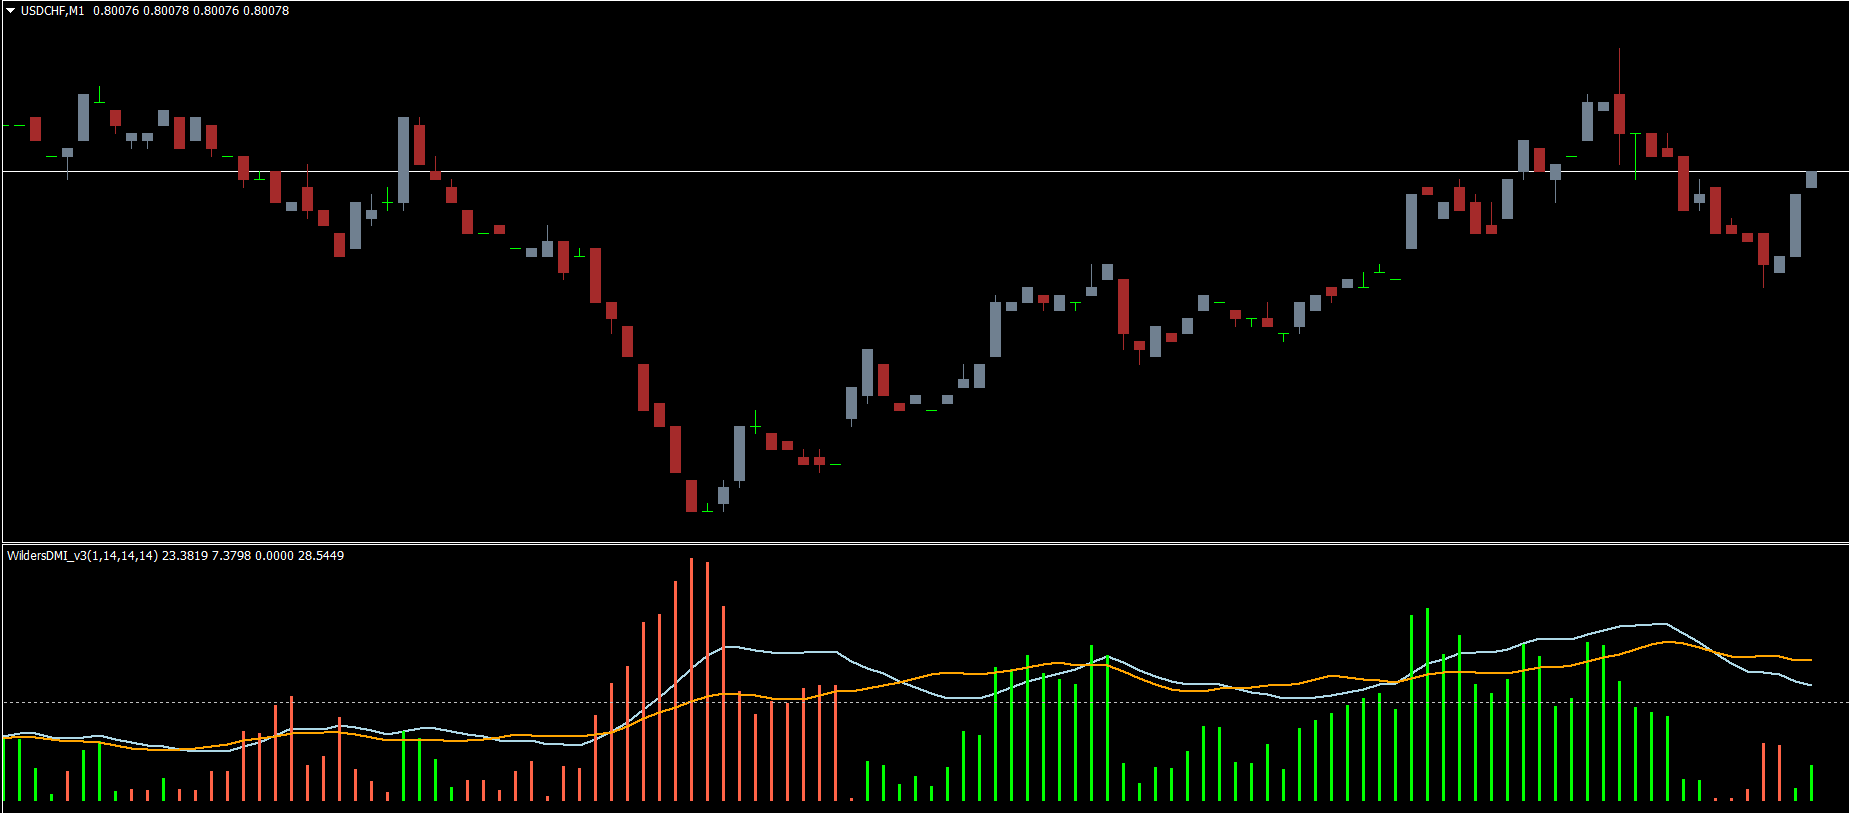
The Wilders DMI Oscillator measures trend direction and momentum strength using the interaction between the +DI and -DI lines and the histogram:
Trend Direction:
Buy Signal: +DI (light blue) is above -DI (orange).
Sell Signal: -DI (orange) is above +DI (light blue).
Trend Strength:
Histogram above the 20 level indicates a strong trend.
Histogram colors represent trend momentum: lime for uptrend, tomato for downtrend.
The intersection of +DI and -DI lines signals a potential trend change.
Histogram color changes also help confirm reversals.
Trading Strategy Using Wilders DMI Oscillator
1. Buy Signal (Long Position):
+DI (light blue) is above -DI (orange).
Histogram above 20 level and colored lime.
Confirm with additional tools like support/resistance or Price Action patterns.
Exit when +DI crosses below -DI or histogram turns tomato.
2. Sell Signal (Short Position):
-DI (orange) is above +DI (light blue).
Histogram above 20 level and colored tomato.
Confirm with resistance or other trend-confirming indicators.
Exit when -DI crosses below +DI or histogram changes color.
3. Position Management:
Use stop-losses above recent swing highs/lows.
Apply trailing stops to capture maximum trend movement.
Combine with other MT4 indicators for stronger confirmation.
Real Market Example
For instance, on a GBP/JPY daily chart, the light blue +DI line moves above the orange -DI line. The histogram is above 20 and lime in color, signaling a strong bullish trend. Traders can enter a long position and hold until the +DI crosses below -DI or histogram turns tomato, indicating the start of a downtrend.
This approach allows traders to enter trades during strong momentum while minimizing false signals.
Advantages of Wilders DMI Oscillator
Measures trend direction and strength simultaneously.
Works on all timeframes for intraday, daily, or weekly strategies.
Provides clear visual buy/sell signals with line intersections and histogram colors.
Helps identify trend reversals and strong trend continuations.
Beginner-friendly while also suitable for advanced trading strategies.
Considerations:
Confirm signals with price action, support/resistance, or other technical tools.
Test strategies on a demo account before live trading.
Conclusion
The Wilders DMI Oscillator for MT4 is a reliable tool for traders seeking to identify strong trends and precise entry/exit points. By monitoring the +DI and -DI lines along with the histogram, traders can make informed decisions and optimize their trading performance.
You can download the Wilders DMI Oscillator for MT4 for free at IndicatorForest.com and start trading with trend-strength confirmation today.
FAQ
3 Downloads
Published:
Nov 11, 2025 23:37 PM
Category: