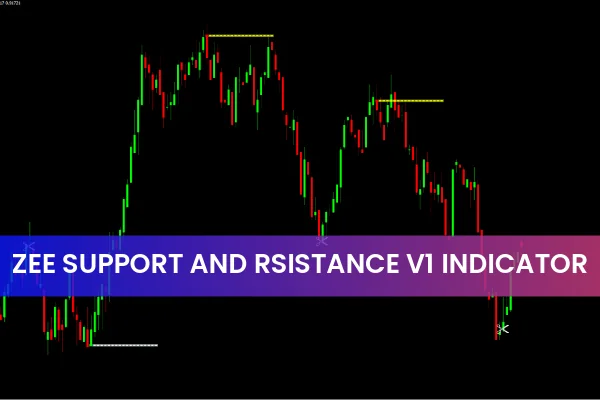
The Zee Support Resistance V1 Indicator for MT4 is a powerful trading tool designed to help forex traders identify reliable Support And Resistance zones. Built on the classic ZigZag indicator, it filters market noise and highlights only meaningful swing highs and lows. By combining these levels with enhanced trading signal filtering, the indicator provides a full system that includes both entry and exit signals. Traders can use this tool to simplify analysis, avoid emotional decision-making, and create a more systematic trading approach. You can find more helpful MT4 tools like this at IndicatorForest.com.
How the Zee Support Resistance V1 Indicator Works
The foundation of the Zee Support Resistance V1 system lies in the ZigZag algorithm. The ZigZag is widely known for eliminating small, insignificant price movements and leaving only the major turning points. This indicator builds on that structure to produce clear trading zones.
Automatic Support and Resistance Generation
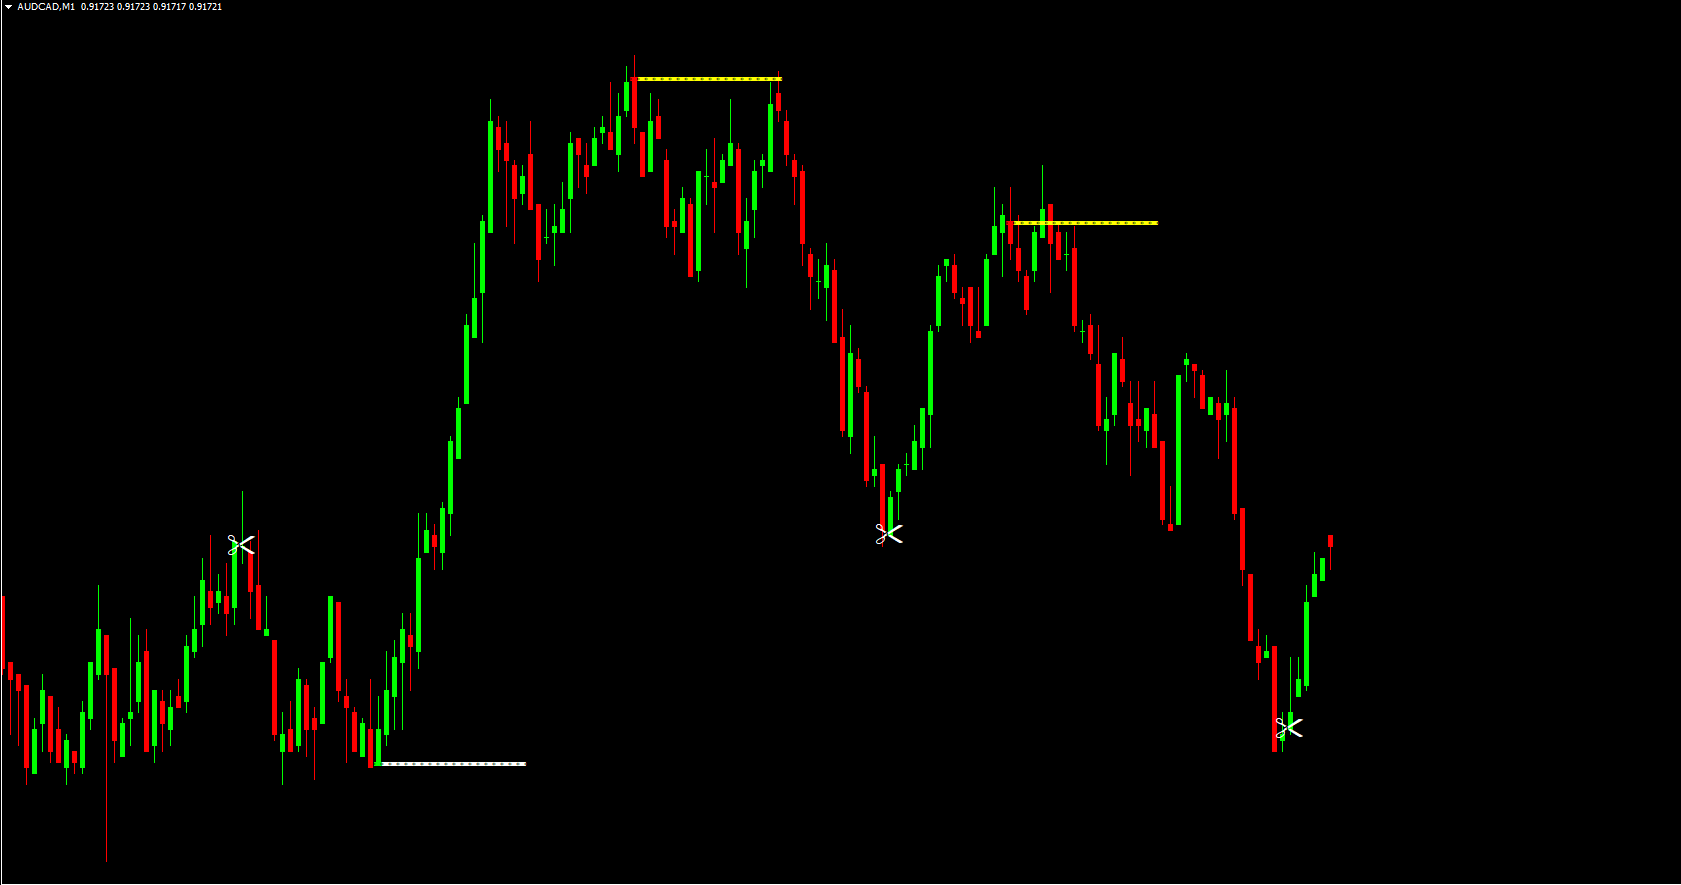
The indicator identifies swing points and converts them into key support and resistance levels. These levels refresh as the ZigZag shifts, which means the indicator may repaint. New traders must be aware of this characteristic, as repainting can affect backtesting and historical visual signals.
Multiple Timeframe Compatibility
One major advantage of the indicator is its versatility. It performs well on:
M1, M5, M15, M30 intraday charts
H1 and H4 medium-term charts
Daily, weekly, and monthly long-term charts
Because ZigZag logic is timeframe-agnostic, the Zee Support Resistance V1 becomes an excellent fit for all styles of trading—from Scalping to swing trading.
Zee Support Resistance V1 Trading Signals
Bullish (Buy) Signals
A white signal line appears when the indicator detects a bullish reversal point. This marks a potential upward trend formation.
Buy strategy rules:
Wait for the white bullish line to appear.
Place a stop loss below the signal line.
Hold the position until:
A scissor-type exit signal appears, or
A new bearish signal is generated.
This structured method helps eliminate hesitation, especially for beginners.
Bearish (Sell) Signals
A yellow signal line represents a bearish reversal. This indicates that price may begin a downward trend.
Sell strategy rules:
Enter short when the yellow bearish line forms.
Stop loss should be placed above the signal line.
Take profit when:
A scissor signal appears, or
A bullish (white) signal forms in the opposite direction.
Using ZigZag Repainting to Your Advantage
Though the indicator may recalculate when new price highs or lows form, repainting isn’t necessarily a disadvantage. Traders can use the real-time updates to maintain accurate support and resistance levels as market conditions evolve.
To improve reliability:
Combine with trend indicators (e.g., Moving Averages)
Use momentum tools (like RSI or MACD) for added confirmation
Avoid trading right after major news releases
Confirm signals on a higher timeframe
This blended approach improves precision and reduces false trades.
Why This Indicator Is Useful for Traders
The Zee Support Resistance V1 Indicator offers several trading benefits:
Automatically identifies strong market levels
Eliminates subjective support/resistance drawing
Provides clear buy/sell signals
Works for new and experienced traders
Integrates well with nearly any trading strategy
Enhances clarity on all timeframes
Because it handles both analysis and signal generation, the indicator becomes a compact and efficient trading solution.
Conclusion
The Zee Support Resistance V1 Indicator for MT4 is a reliable ZigZag-based support and resistance tool that helps traders identify high-quality buy and sell opportunities. With automatic plotting, clear signals, and compatibility across all timeframes, it serves as an ideal choice for beginners and advanced traders alike. Explore more powerful trading tools and indicators at IndicatorForest.com.
FAQ
3 Downloads
Published:
Nov 13, 2025 23:04 PM
Category: