Advanced Market Geometry with the Zigzag Fibonacci Fan Indicator
In financial trading, identifying Market Structure and projecting future reversal zones are two of the most critical steps to establishing a profitable edge. While standard charting tools require traders to manually locate swings and draw complex lines, advanced algorithmic tools can automate this workflow. The Zigzag Fibonacci Fan indicator for MetaTrader seamlessly blends structural swing identification with geometric trend expansion, providing traders with an all-in-one visual framework for tracking complex Price Action.
Download Zigzag Fibonacci Fan for free. Automate swing high/low detection and project dynamic geometric trend angles on your MT4 charts.
The Confluence of Structural Swings and Fibonacci Angles
To truly understand market direction, a trader must filter out daily market noise and focus on true swing highs and swing lows. The Zigzag Fibonacci Fan achieves this by leveraging two classic technical analysis concepts:
- The Zigzag Algorithm: This core protocol filters out minor price fluctuations based on a percentage or pip threshold. It connects significant market peaks and troughs with clean structural trendlines, making market geometry immediately visible.
- Fibonacci Fan Lines: Drawn from a major structural peak to a major trough, these fan lines use crucial mathematical ratios—such as $38.2\%$, $50.0\%$, and $61.8\%$. Unlike static horizontal levels, fans project diagonal Support And Resistance angles that adapt dynamically to the passage of time.
By marrying these two systems, the indicator automatically anchors its Fibonacci fan structures to the most valid, statistically significant swing points on your chart, removing human error and emotional bias from the equation.
Visualizing Trend Acceleration and Deceleration
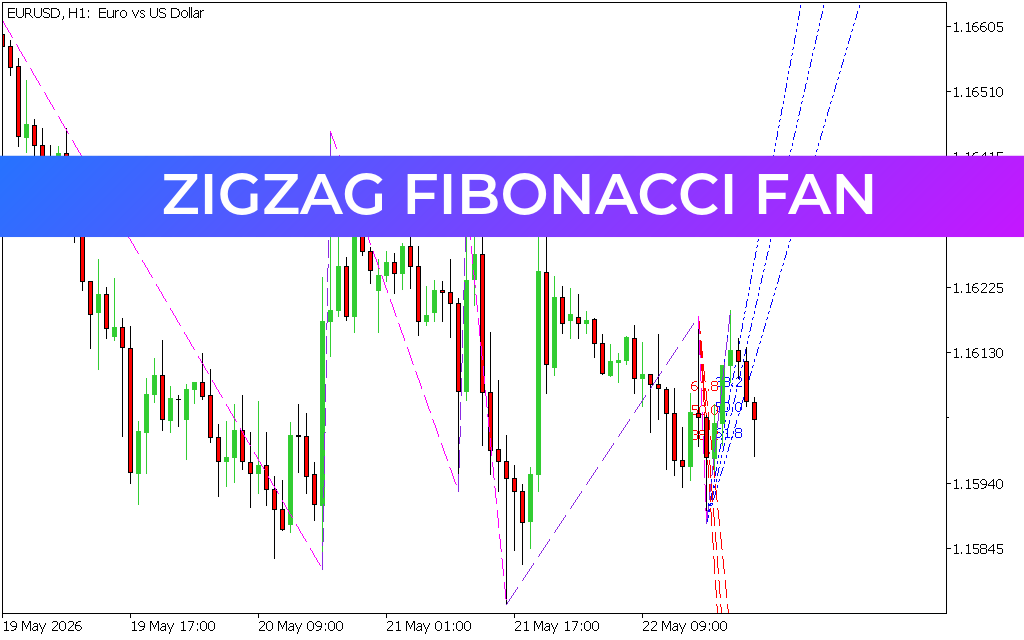
As displayed on the EURUSD H1 chart, the indicator presents a beautifully structured, multi-colored geometric overlay that tracks institutional flow across different market phases:
- The Magenta Zigzag Line: This sharp, dotted line instantly charts the underlying swing structure, visually mapping out clear lower lows, higher highs, and structural market shifts.
- The Dynamic Fan Rays (Blue and Red Dashed Lines): These mathematical angles fan out into the future from the most recent swing point. The blue lines project upward geometric boundaries to track bullish expansion, while the red lines chart downward projections to manage bearish pressure.
The indicator explicitly prints the key mathematical levels—$38.2$, $50.0$, and $61.8$—directly at the intersection points on the chart. This layout allows you to observe exactly how price action reacts when it tests these diagonal golden ratios, exposing hidden zones where institutional algorithms are likely to hunt for liquidity.
Developing a System Around Geometric Support and Resistance
The Zigzag Fibonacci Fan indicator is incredibly versatile and adapts well to both trend-continuation and mean-reversion strategies. For instance, in an established trend, a trader can wait for a corrective pullback to test one of the dynamic fan lines. If price respects the $50.0\%$ or $61.8\%$ diagonal angle with a strong candlestick rejection pattern, it provides a highly objective, tight-risk entry point to ride the next major leg of the trend.
By automating structural swing detection and dynamic angle projection, this indicator lets you spend less time drawing lines and more time executing high-probability setups with absolute precision.
3 Downloads
Last Update:
May 24, 2026 01:58 AM
Published:
Jan 15, 2026 20:24 PM
Category: