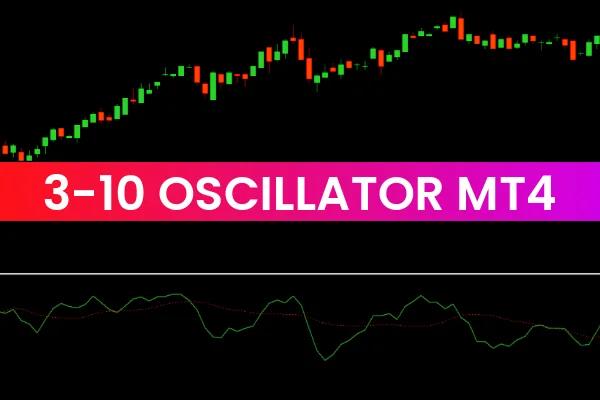
The 3-10 Oscillator Indicator is a momentum-based trading tool designed to help traders spot trend reversals, overbought and oversold zones, and potential trade setups. Similar to the classic MACD (Moving Average Convergence Divergence) but with refined sensitivity, the 3-10 Oscillator uses two exponential moving averages (EMAs) and a signal line to smooth price fluctuations. Traders use this enhanced oscillator to identify shifts in market momentum while filtering out short-term noise — a crucial advantage for both beginners and experienced analysts.
How the 3-10 Oscillator Works
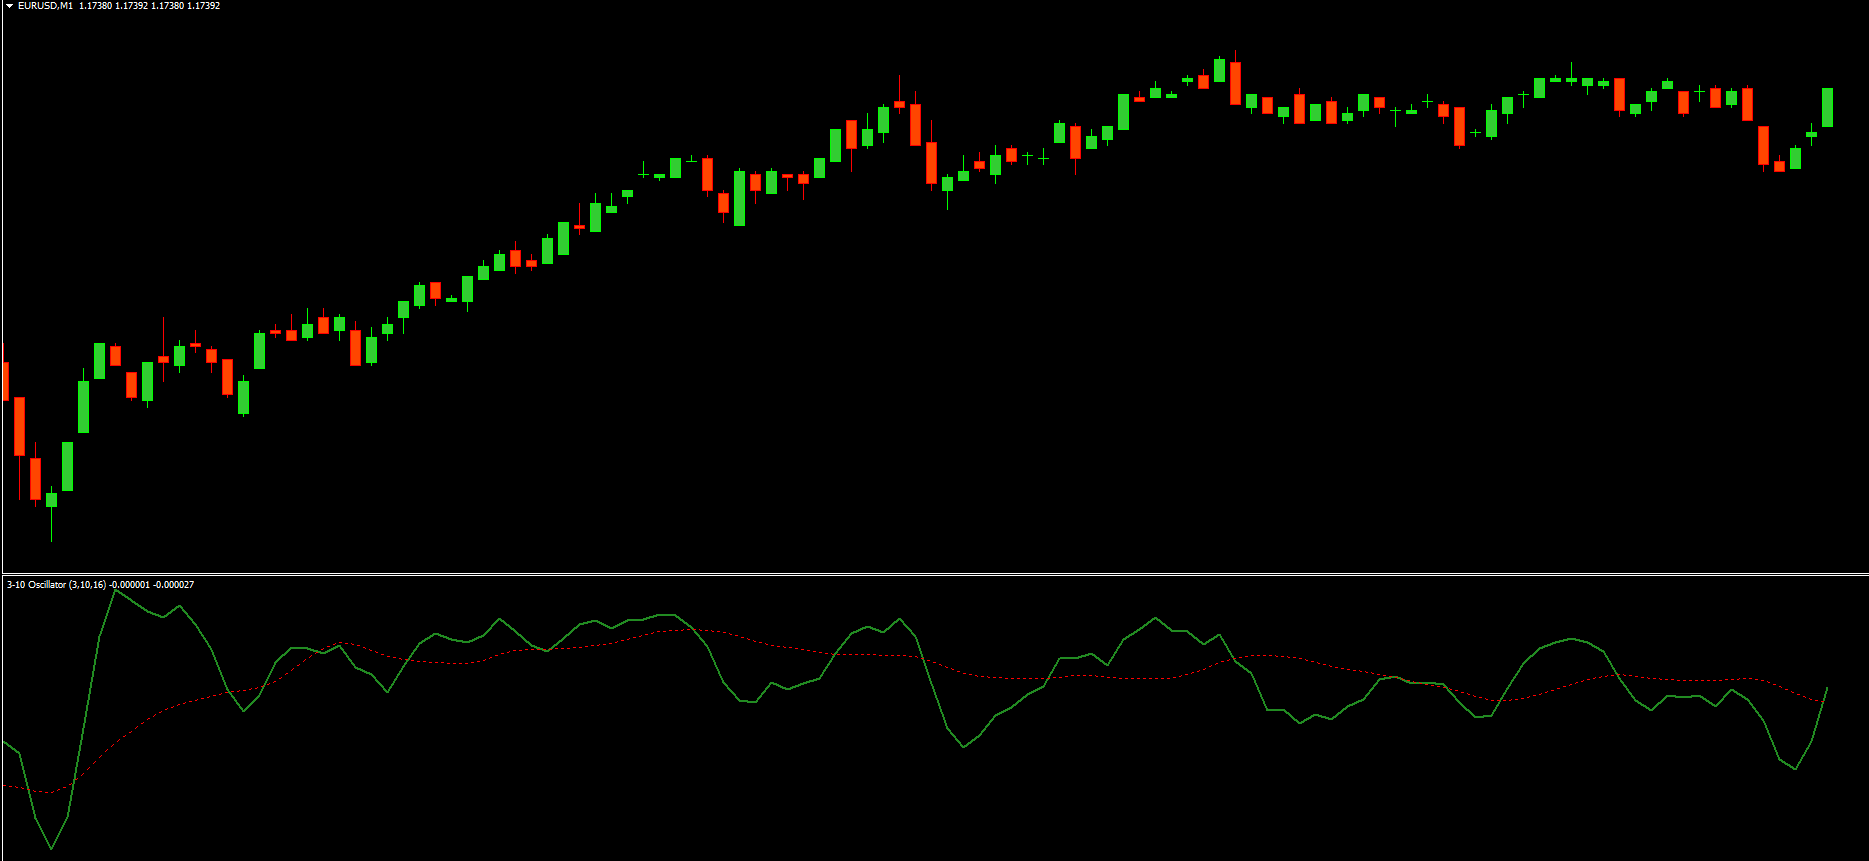
The 3-10 Oscillator is based on the difference between a short-term (3-period) and a medium-term (10-period) moving average. The result is plotted as an oscillator line, often accompanied by a 16-period signal line that helps confirm momentum changes.
When the fast moving average (3-period) crosses above the slow moving average (10-period), it suggests that bullish momentum is increasing — a potential buy signal. Conversely, when the fast line crosses below the slow line, it signals bearish momentum and a potential sell opportunity.
This design makes the indicator highly responsive to market conditions, providing early warnings of possible reversals and trend continuations.
3-10 Oscillator Trading Signals
Understanding the signals generated by the 3-10 Oscillator can significantly improve your timing and accuracy in trades.
1. Bullish Signals
When the oscillator line crosses above the zero level or the signal line, it reflects strengthening buying pressure. This often occurs at the start of a new uptrend, making it an ideal time to look for long entries.
2. Bearish Signals
When the oscillator line moves below the signal line or drops under the zero line, it indicates that sellers are taking control — a potential opportunity to go short or exit long positions.
3. Overbought and Oversold Conditions
Extreme oscillator readings can signal that a market is overextended. When the oscillator reaches unusually high levels, it suggests overbought conditions, while very low readings may indicate oversold markets. These zones often precede trend corrections or reversals.
How to Use the 3-10 Oscillator in a Trading Strategy
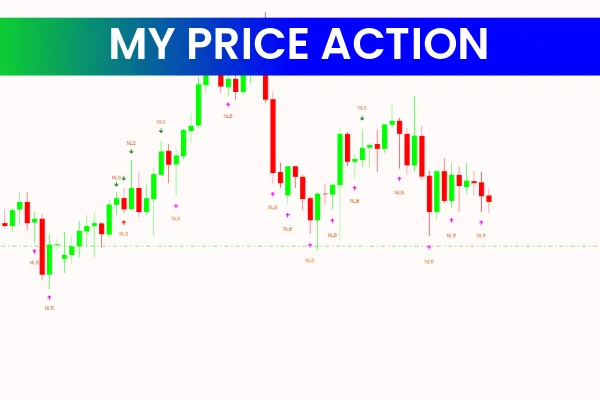
To maximize results, traders often combine the 3-10 Oscillator with Price Action analysis and support/resistance zones.
Here’s a simple strategy:
Identify the trend direction on a higher timeframe using moving averages or trendlines.
Use the 3-10 Oscillator on a lower timeframe to pinpoint entry and exit points.
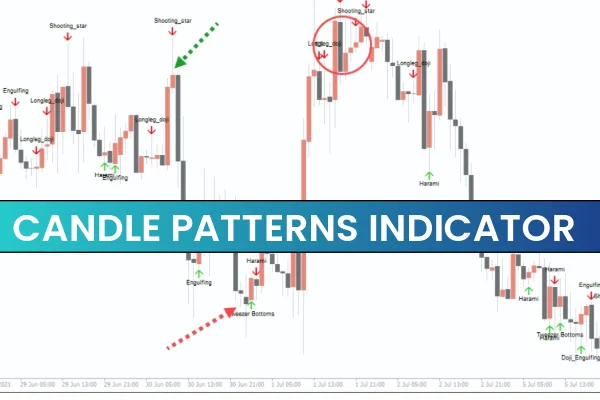
Wait for confirmation — for example, a bullish crossover supported by volume or candlestick patterns.
Set stop-loss levels below recent swing lows (for buys) or above swing highs (for sells).
This systematic approach helps reduce false signals and aligns trades with broader market trends.
Benefits of Using the 3-10 Oscillator Indicator
Provides early momentum signals before major price shifts.
Filters market noise, giving cleaner entry points.
Works effectively across forex, stocks, and crypto markets.
Enhances existing technical analysis setups when combined with other indicators like RSI or MACD.
By incorporating this oscillator into your toolkit, you’ll gain a sharper perspective on momentum shifts and trend dynamics.
Conclusion
The 3-10 Oscillator Indicator is an invaluable addition for traders who want to refine their momentum analysis and identify profitable setups with greater confidence. Its ability to highlight trend reversals, momentum surges, and market extremes makes it a must-have for modern trading systems.
👉 Visit IndicatorForest.com today to download the 3-10 Oscillator Indicator and explore more advanced trading tools and strategies to elevate your market performance.
FAQ
Published:
Dec 18, 2025 10:56 AM
Category: