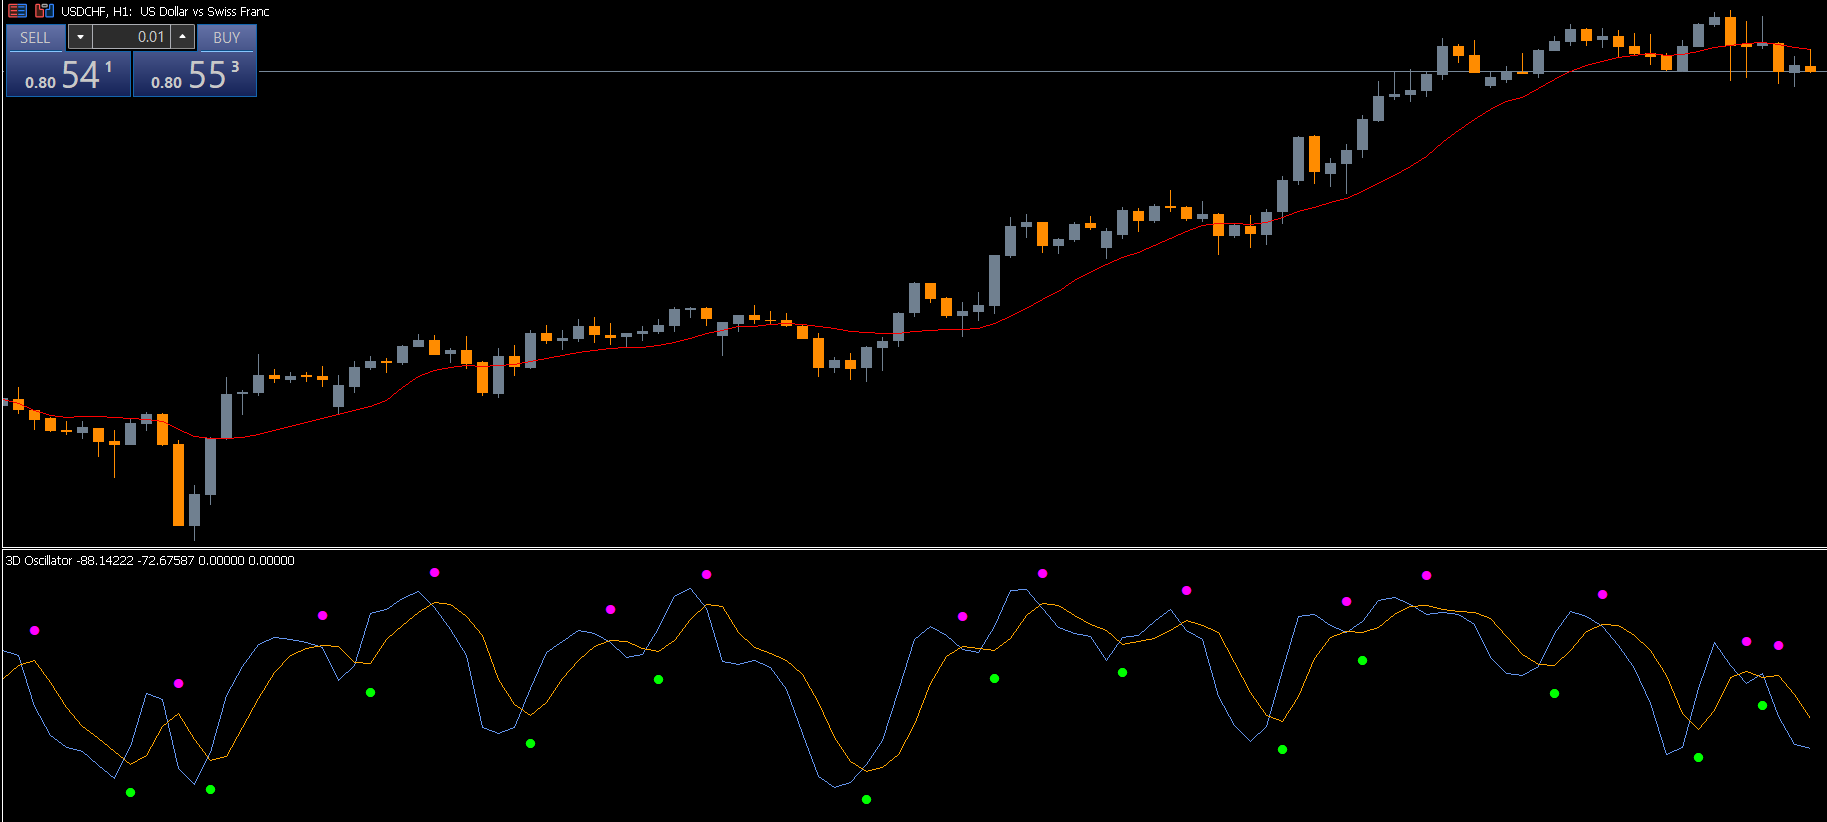
The 3D Oscillator Indicator for MT5 is an enhanced version of the classic Stochastic Oscillator. Like the traditional stochastic, it consists of two main lines: %K and %D. The %K line reflects the current market momentum, while the %D line, which is a moving average of the %K line, is used to generate more reliable entry and exit signals.
The indicator works across all timeframes, but traders typically achieve stronger accuracy when using it on higher timeframes to reduce market noise and avoid false signals.
How to Use the 3D Oscillator Indicator for MT5
The AUDNZD H4 chart example above highlights the BUY and SELL signals generated by the indicator.
The core method for using this tool is by monitoring overbought and oversold conditions:
When the oscillator rises above the 80 level, the asset may be overbought, providing a potential opportunity to enter short positions.
When the oscillator falls below the 20 level, the asset may be oversold, indicating an opportunity to go long.
Just like traditional stochastic analysis, the 3D Oscillator can also reveal divergences:
Bearish Divergence: Price makes a higher high while the oscillator makes a lower high → potential trend reversal downward.
Bullish Divergence: Price makes a lower low while the oscillator makes a higher low → potential reversal upward.
Because market conditions are constantly changing, the accuracy of the signals can vary. For best results, traders often pair the 3D Oscillator with additional indicators such as moving averages, MACD, or key support and resistance levels.
Conclusion
The 3D Oscillator Indicator for MT5 builds on the strengths of the traditional Stochastic Oscillator by offering dynamic momentum readings and enhanced signal clarity. By identifying overbought, oversold, and divergence conditions, it helps traders find high-probability entry and exit points.
As with all indicators, combining it with other forms of technical analysis increases reliability and reduces unwanted false signals.
FAQ
1 Download
Published:
Nov 20, 2025 13:42 PM
Category: