Maximize Intraday Momentum with the Derivative Oscillator Indicator
For fast-paced scalpers and day traders, identifying early shifts in market speed before they reflect in raw Price Action is the ultimate goal. Standard momentum oscillators, like the Relative Strength Index (RSI), are highly valuable technical analysis tools but often present an operational challenge: calculation lag. By the time a traditional oscillator line moves from an oversold floor to an overbought ceiling, the heart of the market expansion is frequently over. The Derivative Oscillator resolves this operational friction by applying a smoothed moving average matrix to advanced relative strength formulas.
This premium MetaTrader charting utility strips away erratic market noise, providing day traders with a highly responsive, rule-based roadmap to spot institutional accumulation and distribution phases early.
Understanding the Mathematics of Smoothed Momentum
The core technical advantage of the Derivative Oscillator lies in its multi-layered smoothing structure. Rather than plotting a simple lagging momentum vector, the underlying algorithm calculates a standard 14-period RSI and then subjects that data stream to exponential smoothing. Finally, it calculates a signal baseline from that smoothed result and plots the difference as a real-time histogram.
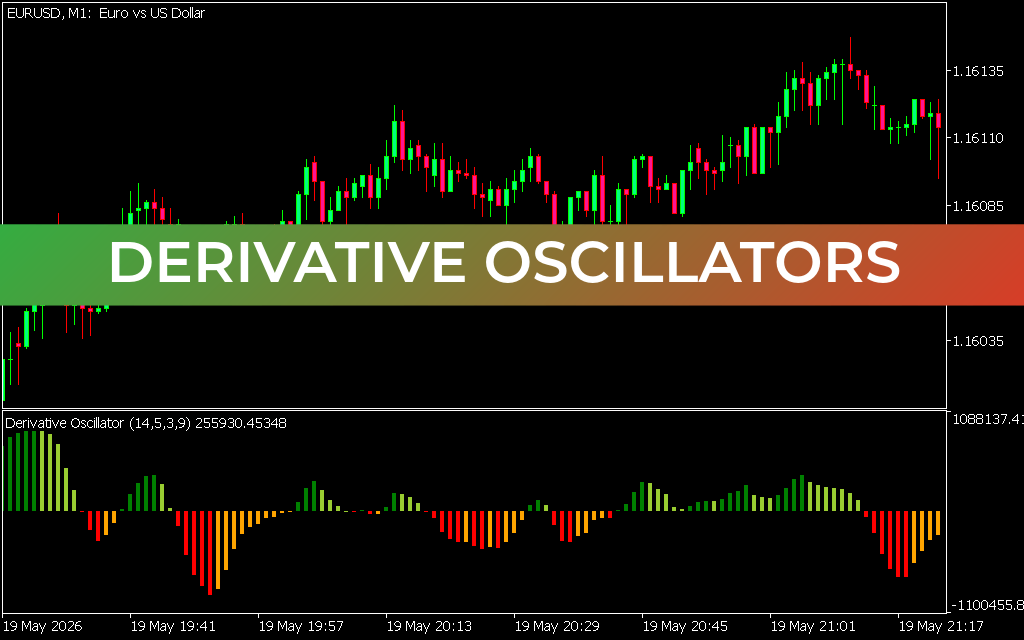
As shown on the 1-minute ($M1$) EUR/USD workspace running parameters like Derivative Oscillator (14,5,3,9), the indicator transforms volatile capital swings into a clean visual dashboard:
- The Central Zero Equilibrium Baseline: The core axis of the technical sub-window represents absolute price equilibrium. When histogram bars cross this threshold, it marks a definitive shift in structural control.
- Bullish Expansion Histograms (Green/Yellow Bars): Rising green bars reflect surging upward momentum, showing that institutional buying volume is accelerating. As a rally matures and slows, the bars switch to a yellow tint, giving a clear visual warning of potential buyers' exhaustion.
- Bearish Markdown Histograms (Red/Orange Bars): Deep red bars expand downward during aggressive selloffs, confirming strong market distribution. When the downward trend begins losing steam, the histogram elements transition to an orange color, signaling that seller volume is drying up.
Implementing Rule-Based Execution Strategies
Integrating the systematic visual parameters of the Derivative Oscillator into your trading strategy creates an objective framework for navigating volatile currency swings.
1. Trading the Zero-Line Momentum Breakout
The cleanest entry signal occurs when the histogram bars cross the central zero baseline. When a market consolidation ends and a fresh bar punches above the zero axis—shifting from red to bright green—it signals a powerful bullish breakout. This transition gives technical analysts an objective, early trigger to enter a long position alongside fresh institutional velocity.
2. Spotting Reversals with Momentum Exhaustion
Entering trades late in an extended trend often leads to severe drawdowns. The Derivative Oscillator protects your trading capital by highlighting active momentum exhaustion. If price action pushes to a new local high but the indicator’s green bars shrink and turn yellow, it reveals a hidden bearish divergence. This clear visual alert tells day traders to tighten stop-losses or prepare for an incoming Trend Reversal.
47 Downloads
Last Update:
May 20, 2026 02:28 AM
Published:
Jan 18, 2026 19:44 PM
Category: