Simplify Your Trading with the Professional Pivot Indicator
In the fast-moving world of financial markets, identifying the "true" price of an asset is the foundation of every successful trading strategy. While many indicators rely on complex mathematical formulas that lag behind current Price Action, the Pivot Indicator uses a time-tested methodology to identify the most significant price levels of the day. Used by floor traders long before the digital age, pivot points remain one of the most reliable ways to predict market sentiment and potential turning points.
What is a Pivot Indicator?
A Pivot Indicator is a predictive technical analysis tool that calculates a series of Support And Resistance levels based on the high, low, and closing prices of a previous period. The central level is known as the "Pivot Point" (PP). When price is trading above this central pivot, the market sentiment is considered bullish; when it is below, the sentiment is bearish.
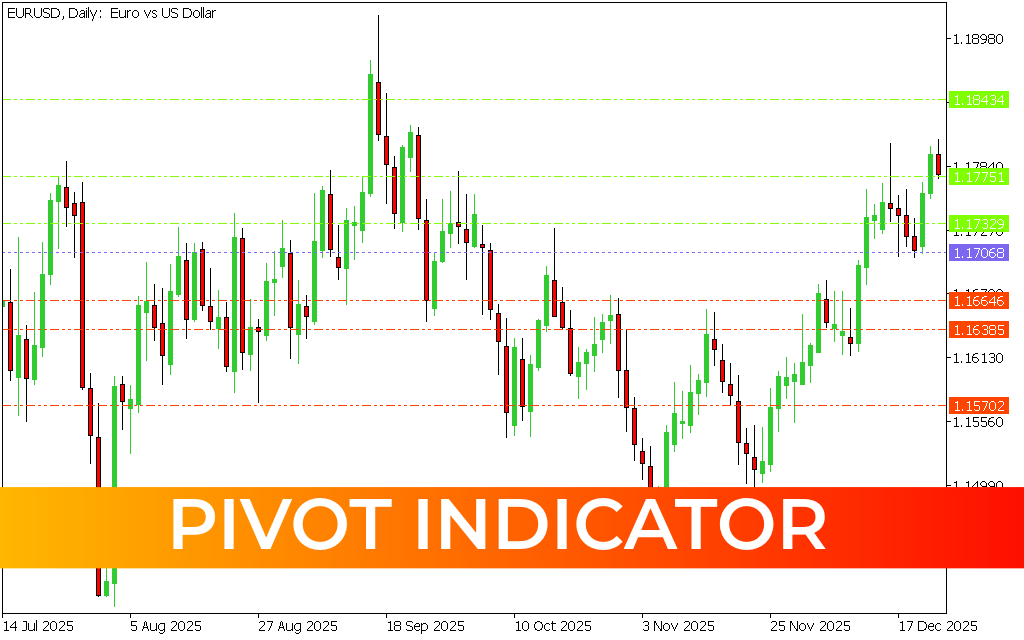
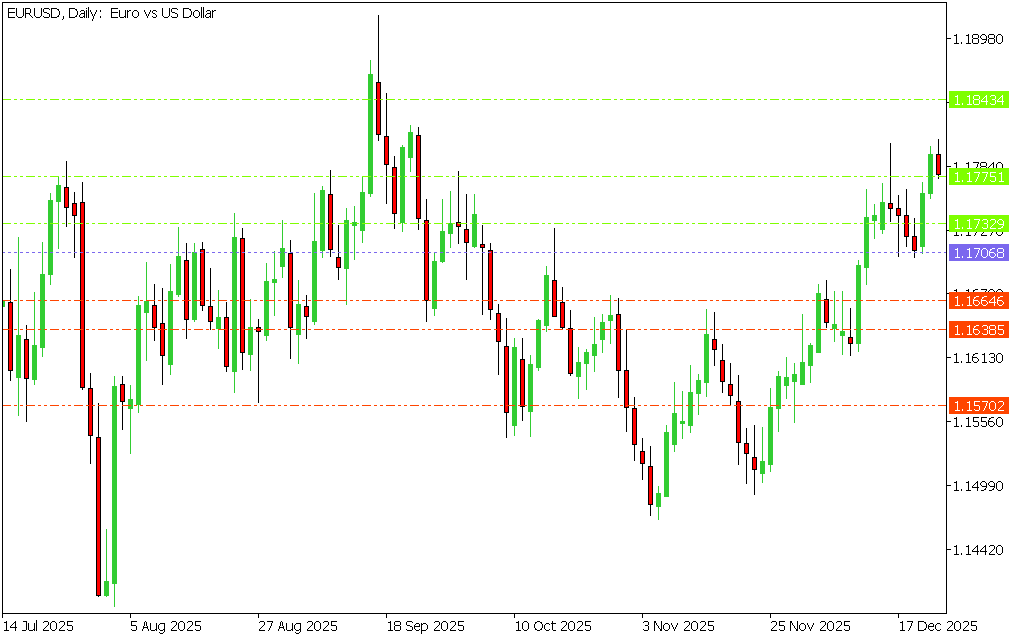
As seen in the technical display of EURUSD_Daily.png, the indicator projects multiple levels onto the chart. These include several resistance levels above the pivot (often labeled R1, R2, R3) and several support levels below (S1, S2, S3). These levels act as a psychological roadmap for market participants.
The Strategic Advantage of Pivot Points
- Objective Support and Resistance: Unlike manual trendlines which can be subjective, the Pivot Indicator provides fixed, mathematical levels. These are the same levels watched by institutional banks and hedge funds, creating a self-fulfilling prophecy where price often reacts exactly at these lines.
- Instant Market Bias: At the start of a trading session, a quick glance at the pivot point tells you whether you should be looking for buy or sell opportunities.
- Precise Target Setting: The Pivot Indicator is an excellent tool for setting take-profit and stop-loss levels. For example, if you enter a long trade at the pivot, the R1 or R2 levels provide natural, high-probability targets for exiting the trade.
- Versatility Across Timeframes: While most commonly used by intraday traders on M15 or H1 charts, the same logic applies to daily and weekly charts for swing traders, as demonstrated in the daily view of EURUSD_Daily.png.
How to Use Pivot Points in Your Strategy
The most effective way to utilize this tool is to look for price rejection or breakouts at the projected levels.
- The Reversal Trade: If price approaches a major resistance level (like R2) and starts to consolidate or show a bearish candlestick pattern, it signals a high-probability reversal trade back toward the central pivot.
- The Breakout Trade: In a trending market, a strong candle closing above a resistance level suggests the trend has enough momentum to reach the next level (R3).
Conclusion
The Pivot Indicator is a foundational tool that brings institutional-grade clarity to retail trading platforms. By identifying the key battlegrounds where buyers and sellers are most likely to interact, it allows you to trade with increased confidence and precision. Whether you are a scalper or a long-term investor, the pivot point is your ultimate guide to market equilibrium.
1 Download
Last Update:
May 05, 2026 20:06 PM
Published:
Jan 27, 2026 14:27 PM
Category: