Master Trend Explosions with the ADX Crosses Indicator
In the world of technical analysis, knowing the direction of a trend is only half the battle; knowing the strength of that trend is what separates profitable entries from low-conviction gambles. The ADX Crosses indicator for MetaTrader 4 (MT4) and MT5 is a professional-grade momentum utility designed to identify high-probability trend transitions. By focusing on the interaction between Directional Indicators (DI) and the Average Directional Index (ADX), this tool provides traders with a definitive edge in catching explosive market moves early.
The Anatomy of Trend Strength
The ADX Crosses indicator is based on J. Welles Wilder’s Directional Movement System. Unlike standard oscillators that merely show overbought or oversold conditions, the ADX system measures the actual velocity of the trend. The indicator consists of three core components visualized in a dedicated sub-window:
- +DI Line (Green/Blue): Measures bullish momentum. When this line is rising, buyers are in control.
- -DI Line (Red): Measures bearish momentum. When this line is rising, sellers are dominating the Price Action.
- The ADX Line (Yellow/White): This is the "Strength" filter. It does not indicate direction, but rather the intensity of the current move. A rising ADX line suggests a strengthening trend, while a falling line indicates a weakening market.
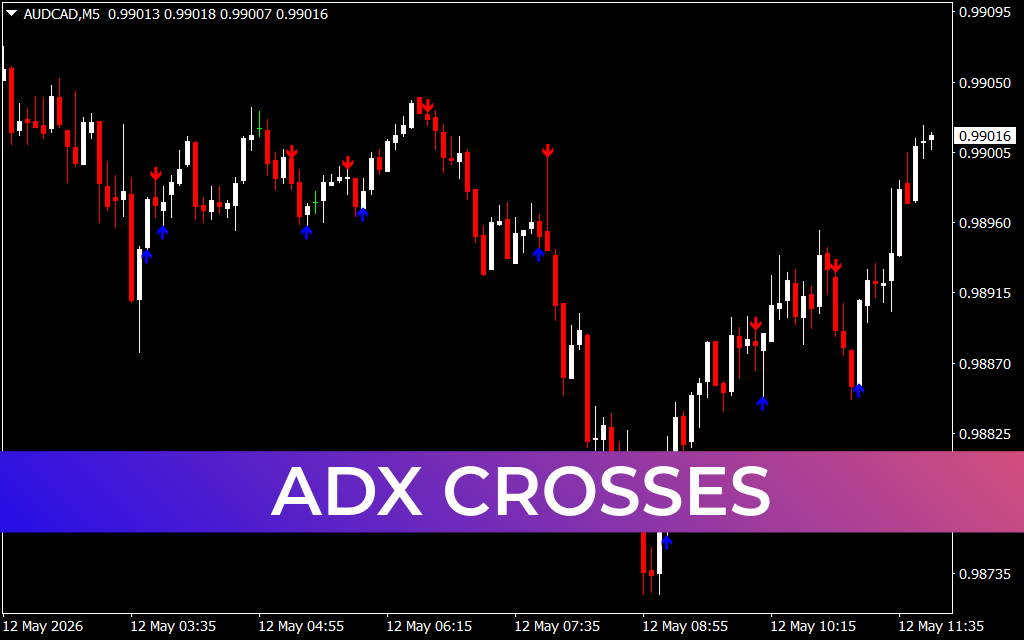
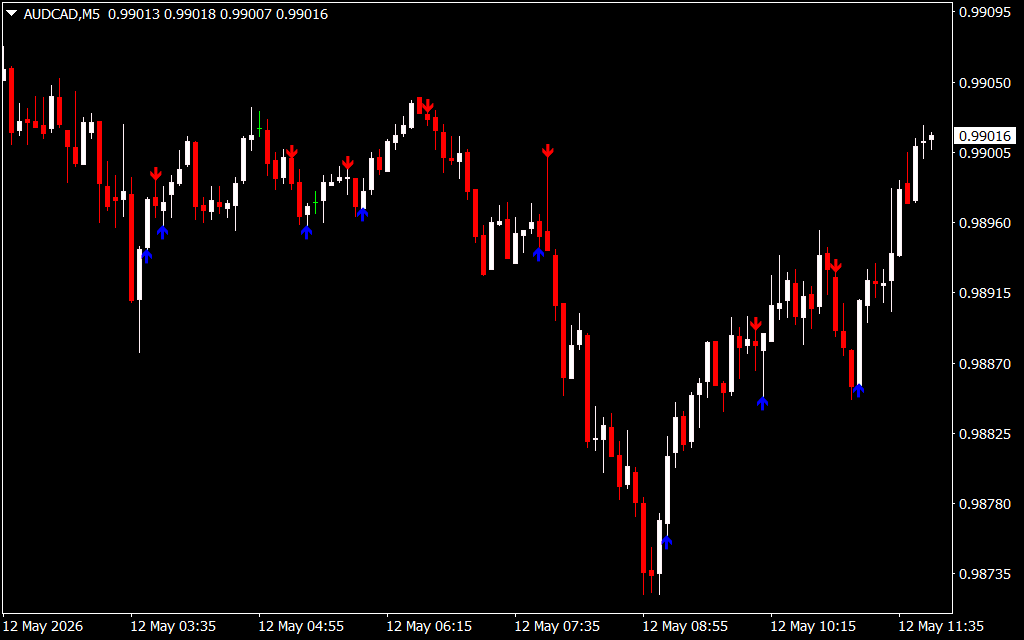
As illustrated in the AUD/CAD M5 chart, the indicator provides clear visual "Crosses." When the +DI crosses above the -DI, it signals a bullish transition; when the -DI crosses above the +DI, a bearish shift is underway.
Strategic Advantages for Professional Scalpers
The ADX Crosses indicator is a favorite for intraday traders due to its ability to filter out "fake-outs" in sideways markets:
- Mechanical Entry Triggers: The moment the DI lines cross, the indicator generates a visual signal. This removes the emotional hesitation often felt during fast-moving M1 or M5 sessions.
- Trend Strength Filtering: A classic professional strategy is to only take DI crosses when the main ADX line is above a specific threshold (typically 20 or 25). This ensures you are only trading when there is sufficient "fuel" in the market to sustain a move.
- Visualizing Exhaustion: When the DI lines reach extreme widths and the ADX line begins to flatten or hook downward, it serves as a powerful early warning that the current trend is exhausted and a reversal is imminent.
- Clean Interface: The indicator manages complex calculations in the background, providing a streamlined histogram or line-cross visual that keeps your main price chart clutter-free.
Implementation and Performance
The ADX Crosses indicator is most effective when used as a "Momentum Confirmation" tool. For example, if price breaks out of a consolidation pattern on the AUD/CAD M5 chart, a simultaneous +DI bullish cross provides the necessary confirmation to enter the trade with confidence.
By integrating the ADX Crosses indicator into your technical arsenal, you move away from speculative guesswork. You gain a mathematical lens that quantifies market energy, allowing you to focus your capital only on the strongest, most reliable trends in the Forex and CFD markets.
3 Downloads
Last Update:
May 12, 2026 14:57 PM
Published:
Jan 23, 2026 13:28 PM
Category: