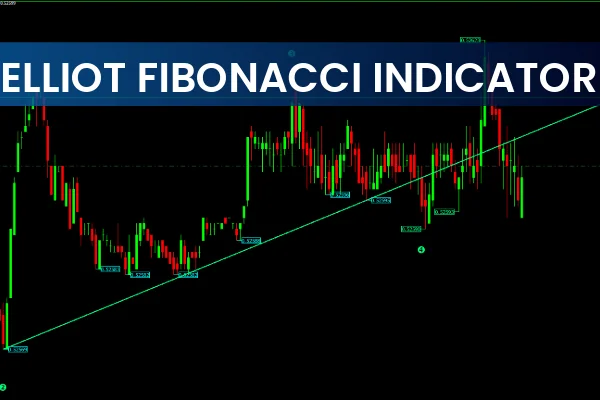
The Elliott Fibonacci Indicator for MT4 automatically identifies Elliott Wave structures on a price chart and draws them visually. In addition, the indicator calculates key Fibonacci retracement and extension levels and overlays them on the active wave. This combination allows forex traders to apply both Elliott Wave theory and Fibonacci ratios simultaneously for trade entries, stop-loss placement, and profit targets.
Typically, Elliott Wave traders use Fibonacci levels to measure expected retracements and extensions, while Fibonacci traders may or may not use Elliott Wave counts. Because this indicator provides both automatically, it is useful for new traders learning wave theory as well as experienced Elliott Wave practitioners.
New traders should be familiar with:
The structure of impulse (motive) waves
The structure of corrective waves
The importance of Fibonacci retracement levels
Advanced traders can combine the indicator with trend-following tools, multi-timeframe analysis, or automated strategies.
Trading Signals — Elliott Fibonacci Indicator for MT4
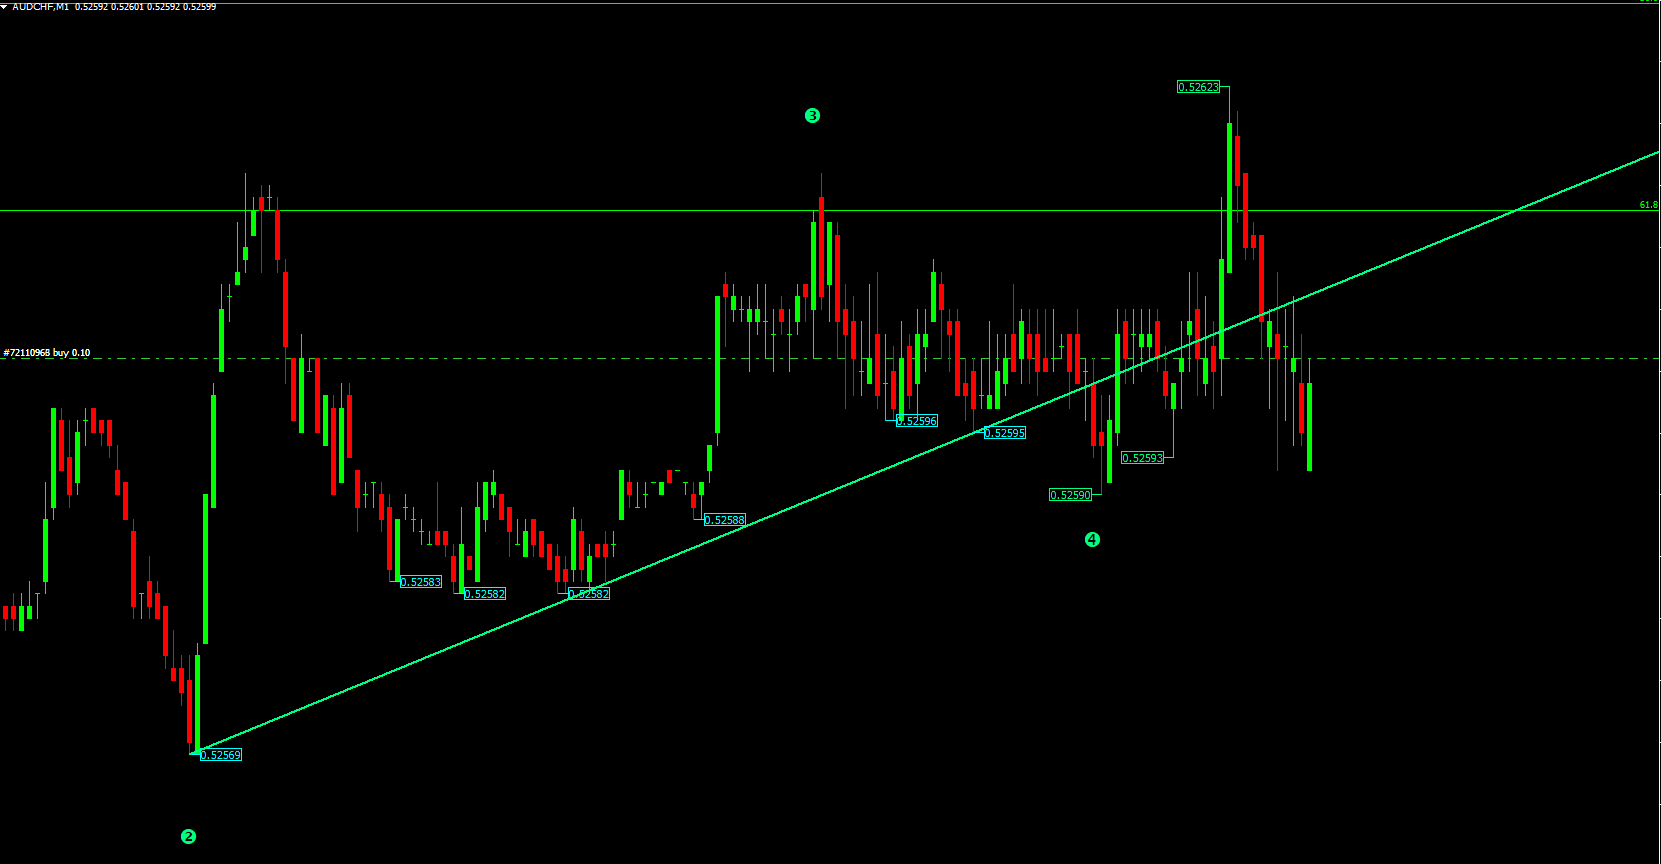
On the EURUSD H1 chart example, the indicator:
Plots Elliott Wave trendlines in green
Draws Fibonacci levels:
Green for upper (bullish) levels
Red for lower (bearish) levels
How Traders Use It
Identify the Trend
The Elliott trendline shows the current dominant market direction:
Uptrend wave → look for buy setups
Downtrend wave → look for sell setups
Entry via Fibonacci Retracements
Fibonacci levels act as ideal areas to re-enter the trend during a pullback:
When price retraces to a Fibonacci zone, traders look for a confirmation to enter the trade.
Nearby Fibonacci levels act as support/resistance, ideal for:
Entry triggers
Stop-loss placement
Profit targets
Combine Wave Context With Fibonacci Levels
For example:
If the Elliott wave indicates an uptrend, traders look for buy entries at Fibonacci retracement support.
If in a corrective wave downtrend, traders look for sell entries at Fibonacci retracement resistance.
Profit targets typically align with:
Adjacent Fibonacci extensions
Next wave completion zones
Conclusion
The Elliott Fibonacci Indicator for MT4 combines two powerful technical analysis tools—Elliott Wave theory and Fibonacci ratios—into an automated system. It identifies impulse and corrective waves, draws Fibonacci levels, and helps traders pinpoint high-probability entry and exit zones.
Because the indicator handles wave counting automatically, traders of all skill levels can integrate wave-based analysis into their strategies with ease.
FAQ
14 Downloads
Published:
Nov 29, 2025 00:03 AM
Category: