The PAMA GannGrid Indicator is a powerful and popular free Forex indicator designed for the MetaTrader 4 platform. It is built on the classic Gann Grid concept developed by W.D. Gann and helps traders identify market trends, Support And Resistance levels, and potential trading opportunities with greater clarity. This indicator is suitable for traders who want a structured and visually clear approach to market analysis.
Gann-based analysis has long been respected for its ability to reveal hidden Market Structure. The PAMA GannGrid Indicator enhances this traditional concept by introducing a color-coded grid system and automated alerts, making it easier to interpret price behavior and react to trading opportunities efficiently.
How the PAMA GannGrid Indicator Works
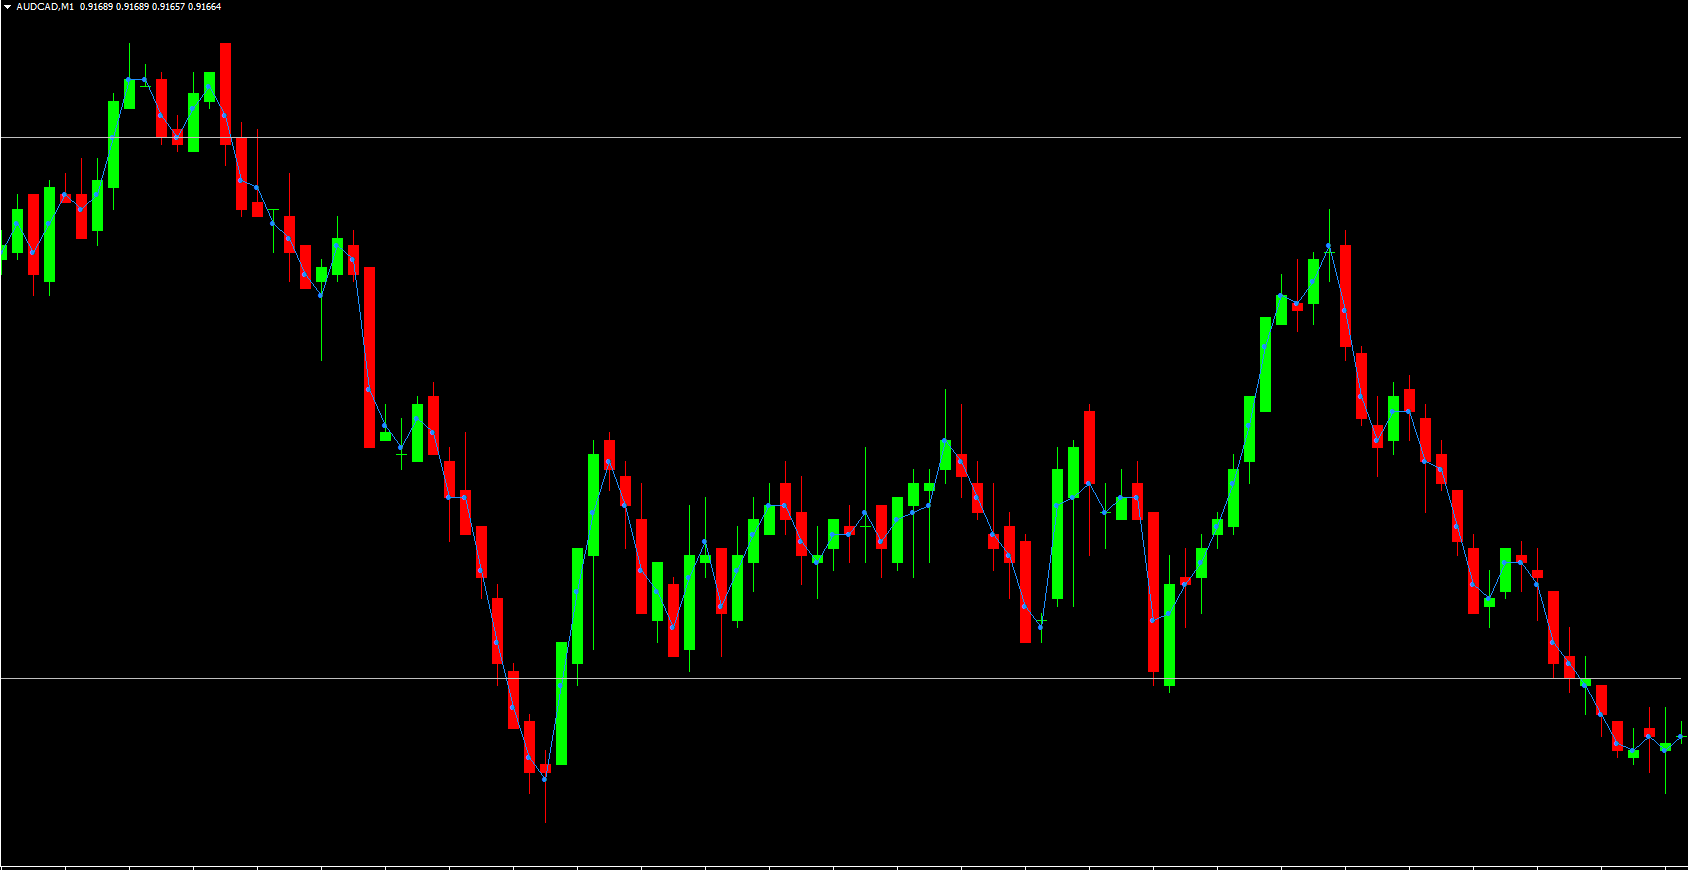
The PAMA GannGrid Indicator automatically plots a grid of horizontal and vertical lines on the chart. These lines represent key price levels derived from Gann Grid principles and act as dynamic support and resistance zones.
Unlike manual Gann grid drawing, this indicator removes complexity by handling all calculations automatically. The grid adapts to price movement, helping traders visually identify where price is likely to pause, reverse, or break through.
The color-coded grid is a key enhancement. Different colors highlight important price zones, making it easier to recognize trend direction and momentum without excessive chart clutter. This visual clarity allows traders to focus on high-probability trading areas.
Identifying Trends with the PAMA GannGrid Indicator
Trend identification is one of the strongest features of the PAMA GannGrid Indicator. When price consistently moves in one direction across the grid levels, it indicates a strong trend. Traders can use this information to align their trades with the dominant market direction.
Price movement within the grid structure helps traders recognize whether the market is trending, ranging, or preparing for a breakout. This insight is critical for avoiding counter-trend trades and improving overall consistency.
Support and Resistance Using Gann Grid Levels
The PAMA GannGrid Indicator excels at highlighting support and resistance levels. Each grid line represents a potential price reaction zone where buying or selling pressure may increase.
Traders can use these levels to plan:
Trade entry points
Stop-loss placement
Profit targets
Breakout strategies
Because the grid is based on proven Gann theory, these levels often align closely with natural market reactions.
Color-Coded Grid for Clear Market Structure
The color-coded grid provides immediate visual feedback on price behavior. Strong price movement through grid levels may indicate Trend Continuation, while repeated rejections at certain levels can signal consolidation or reversal.
This visual structure helps reduce emotional trading and improves discipline by offering objective reference points for decision-making.
Built-In Alert System
Another valuable feature of the PAMA GannGrid Indicator is its alert system. Traders can receive notifications when price approaches or interacts with key grid levels.
Alerts help traders stay informed without constantly monitoring charts, making the indicator suitable for both active and part-time traders. This feature is especially useful for identifying breakout opportunities or potential reversals in real time.
Key Benefits of the PAMA GannGrid Indicator
The PAMA GannGrid Indicator offers several advantages for Forex traders:
Based on proven Gann Grid theory
Automatically plots grid levels on MT4
Identifies trend direction clearly
Highlights strong support and resistance zones
Color-coded grid for easy interpretation
Built-in alert system for trade opportunities
Suitable for beginners and experienced traders
Free to download and easy to use
These benefits make it a versatile indicator for various trading styles.
Suitable Trading Styles and Timeframes
The PAMA GannGrid Indicator can be used across all timeframes and currency pairs. Scalpers can apply it on lower timeframes to identify intraday price levels, while swing and position traders can use it on higher timeframes to follow major trends and market structure.
It works well in trending markets and can also help traders navigate ranging conditions by identifying clear price boundaries.
Combining the Indicator with Other Tools
For enhanced accuracy, traders often combine the PAMA GannGrid Indicator with moving averages, momentum indicators, or volume-based tools. This multi-confirmation approach helps reduce false signals and strengthens trade setups.
Proper risk management remains essential. Traders should always define stop-loss and take-profit levels before entering any trade.
Visit IndicatorForest.com today to download the free PAMA GannGrid Indicator for MT4 and improve your Forex trading with structured Gann-based trend and support analysis.
1 Download
Published:
Dec 25, 2025 14:07 PM
Category: