Trading in the forex market can feel overwhelming with so many indicators available. The All in One Indicator for MT4 aims to solve this problem by combining multiple tools into a single, powerful solution.
This indicator integrates key technical analysis components such as:
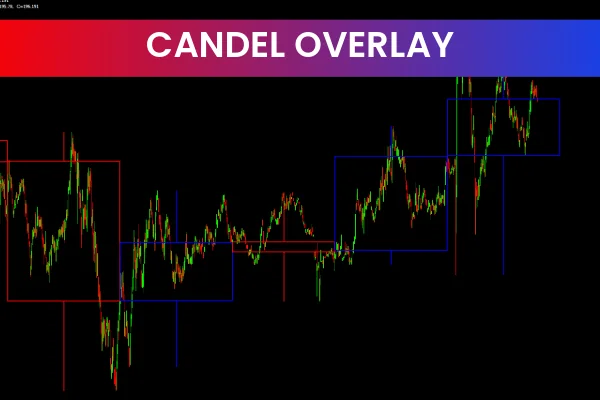
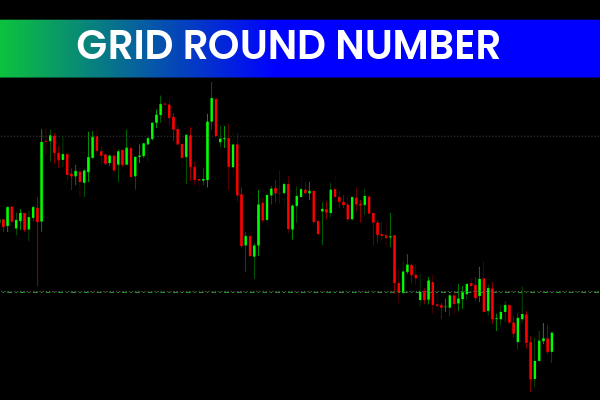
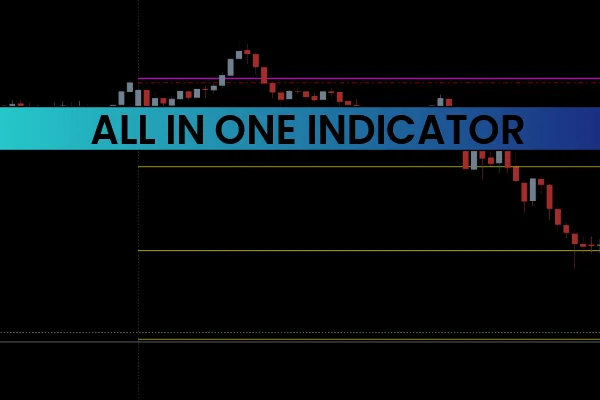
Horizontal support and resistance levels

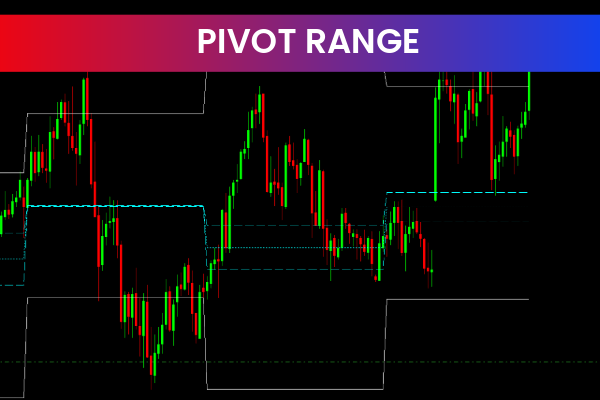
Daily pivot points
Current spread tracker
MTF ATR (Average True Range) values
With these features built into one indicator, traders can easily identify trend direction, volatility levels, and potential entry or exit zones — all from a single chart.
How the All in One Indicator Determines Buy/Sell Signals in MT4
The All in One Indicator simplifies intraday and swing trading by using pivot points and support/resistance zones to determine potential buy and sell signals.
Here’s how it works:
Pivot Levels as Intraday Zones
Pivot points are displayed as key intraday Support And Resistance levels.
When price tests a pivot from below, it often acts as resistance, signaling a potential sell zone.
When price bounces from a lower pivot, it may indicate support, signaling a buy opportunity.
These zones help traders find high-probability reversal or breakout points without manually plotting levels.
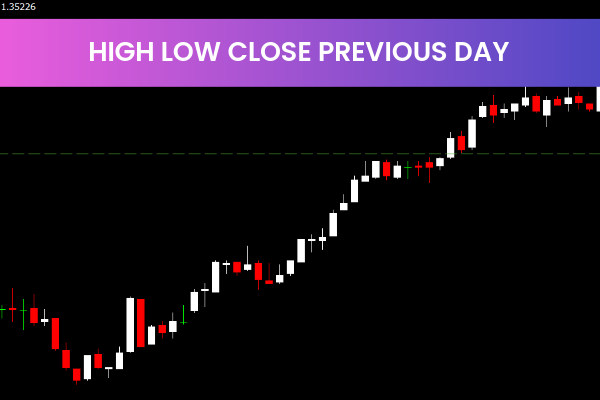
Long-Term S/R Lines (Dotted Levels)
The indicator also draws dotted horizontal lines representing long-term support and resistance areas.
These act as trend boundaries, where price often pauses, reverses, or breaks out strongly.
They’re useful for identifying swing trading setups and for aligning lower-timeframe entries with higher-timeframe structure.
Spread Tracker and ATR Readings
At the top-left corner of the chart, you’ll find key market information, including:
Current spread value – useful for assessing trade execution costs.
ATR (Average True Range) readings on daily and weekly timeframes – help gauge market volatility.
Trend Strength metrics – show whether momentum favors bulls or bears.
This summary gives traders all the essential information at a glance.
Best Way to Trade with the All in One Indicator
Identify market direction using the pivot and S/R zones.
Confirm volatility with ATR readings (low ATR = ranging market, high ATR = trending).
Enter trades near pivot rejections or breakout levels aligned with the major trend.
Manage risk by setting stops just beyond the next pivot or S/R line.
By combining different technical tools into one view, this indicator enhances both efficiency and accuracy in trading decisions.
Conclusion
The All in One Indicator for MT4 is a versatile, feature-packed trading system that consolidates several powerful tools into one. It helps traders make informed decisions by combining support/resistance, pivot analysis, ATR volatility, and spread tracking — all displayed neatly on one chart.
📊 Whether you’re a day trader or swing trader, this indicator can streamline your workflow and improve your accuracy.
✅ Download the All in One Indicator for MT4 free and simplify your forex trading strategy today!
FAQ
8 Downloads
Published:
Nov 11, 2025 12:08 PM
Category: