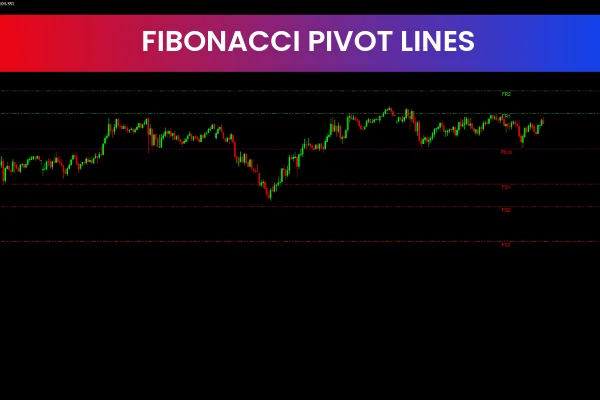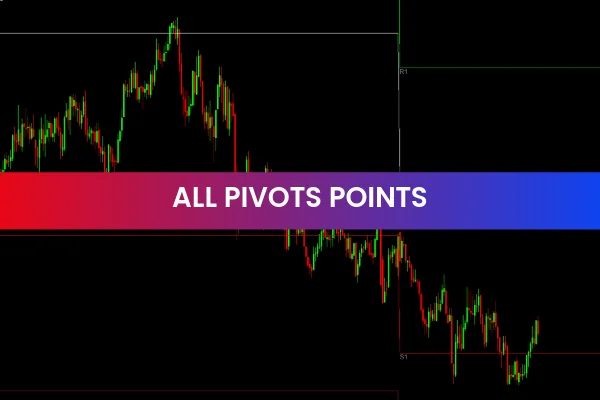
The All Pivot Points Indicator is a popular, free, and highly practical Forex Indicator for the MetaTrader 4 platform. It is designed to help traders accurately identify key Support And Resistance levels using classic pivot point calculations. By plotting these levels directly on the chart, the indicator allows traders to make better-informed decisions regarding trade entries, exits, and risk management.
Pivot points are widely used by professional traders because they provide objective price levels derived from the previous day’s market activity. The All Pivot Points Indicator simplifies this process by automatically calculating and displaying pivot levels, saving traders time and improving chart clarity.
How the All Pivot Points Indicator Works
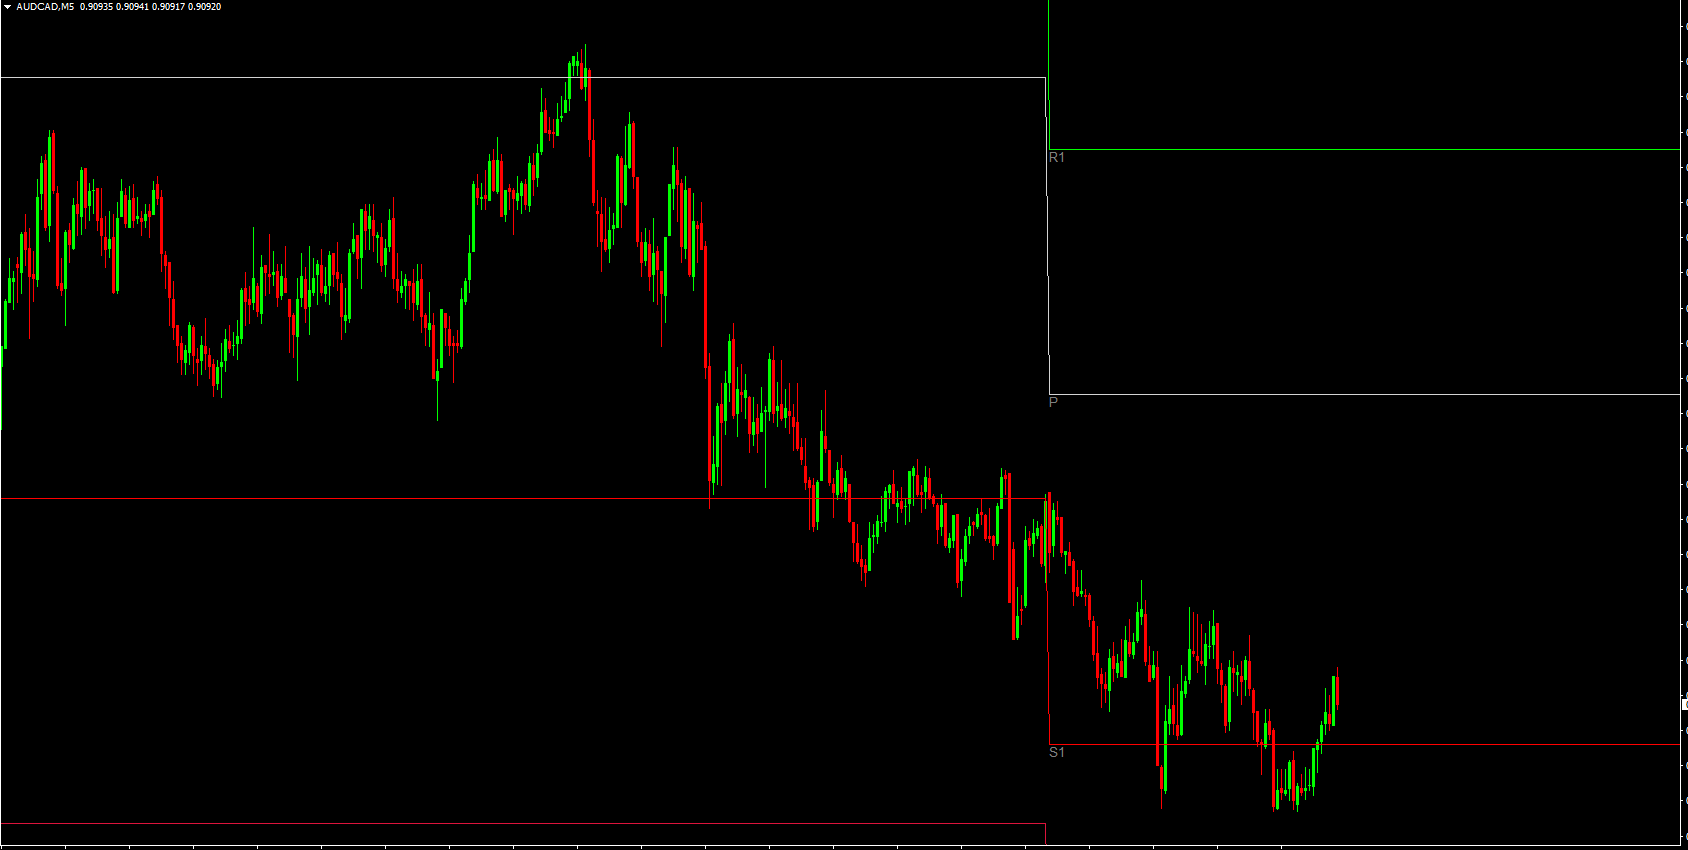
The indicator works by calculating the average of the previous day’s high, low, and close prices. Using this data, it plots the central pivot point along with multiple support and resistance levels directly on the chart. These levels act as potential turning points where price may pause, reverse, or break through.
Once applied to a chart, the indicator instantly displays:
Central pivot point
Multiple support levels
Multiple resistance levels
Previous day’s high, low, and close prices
This information gives traders a structured framework to analyze price behavior throughout the trading session.
Key Features of the All Pivot Points Indicator
One of the main strengths of this indicator is its simplicity combined with accuracy. Traders do not need advanced technical knowledge to use it effectively.
Key features include:
Automatic calculation of pivot points based on daily price data
Clear visualization of support and resistance levels
Display of previous day’s high, low, and close prices
Works on all currency pairs
Compatible with all timeframes on MT4
No manual input required once installed
These features make the All Pivot Points Indicator suitable for beginners while still being valuable for advanced traders.
Why Pivot Points Matter in Forex Trading
Pivot points are widely respected because they reflect market psychology. Many institutional traders and algorithmic systems use pivot levels, which often makes price react strongly around them.
Support levels can indicate areas where buying pressure may increase, while resistance levels often highlight zones where selling pressure becomes stronger. When price approaches these levels, traders can look for confirmation signals such as candlestick patterns, trend indicators, or momentum tools.
Benefits of Using the All Pivot Points Indicator
The All Pivot Points Indicator offers several advantages that can significantly improve trading performance.
First, it helps traders identify high-probability entry and exit zones. Instead of guessing where price might turn, traders have clearly defined levels to work with.
Second, it improves risk management. Stop-loss and take-profit levels can be placed more logically around pivot levels, reducing emotional decision-making.
Third, it enhances trade timing. Traders can wait for price to approach key levels and only enter when conditions align with their strategy.
This indicator is suitable for:
Scalping strategies
Intraday trading
Swing trading
Trend Continuation setups
Reversal-based strategies
How Traders Can Use the Indicator Effectively
Traders often buy near support levels and sell near resistance levels, especially when price shows rejection or confirmation signals. Breakout traders can also use pivot points to identify strong breakouts when price closes decisively beyond a resistance or support level.
Combining the All Pivot Points Indicator with other technical tools such as moving averages, RSI, or trend indicators can further improve accuracy and confidence.
Overall, the All Pivot Points Indicator is a reliable and practical MT4 tool that helps traders trade with structure, discipline, and clarity.
Improve your trading precision today by using the All Pivot Points Indicator. Visit IndicatorForest.com to explore this free MT4 indicator and many more tools designed to support smarter Forex trading.
FAQ
It automatically computes the central pivot point plus multiple support and resistance levels from the previous day’s high, low and close. These levels appear directly on your chart as reference zones.
Traders often look to buy near support pivots and sell near resistance pivots when price shows confirming behavior, or trade breakouts when price closes decisively beyond a pivot level.
Many institutional traders and algorithms pay attention to pivot levels, so price often reacts around them. They act as objective areas where supply and demand may shift.
Daily pivots are most commonly used on intraday charts like M15–H1, but they can also guide swing trades by outlining likely intraday turning zones within the bigger trend.
You can set stop‑losses just beyond support or resistance pivots and place profit targets near the next level. This gives your trades a logical structure around well‑watched price zones.
Published:
Dec 18, 2025 00:04 AM
Category: