Optimizing Trade Execution with the Assistant History Data Indicator
In the financial markets, consistent improvement relies heavily on review and historical analysis. Many traders spend hours manually logging trades, attempting to piece together exactly where their entries and exits occurred relative to historical Market Structure. For MetaTrader users looking to streamline their post-trade review, the Assistant History Data indicator offers an automated, background solution to visually track critical trading windows and structural sessions directly on live execution charts.
The Value of Historical Session Mapping
Successful technical analysis requires an understanding of when and where institutional volume enters the market. Intraday trading is highly dependent on specific market sessions—such as the London or New York cross—and the historical data surrounding day-to-day liquidity sweeps.
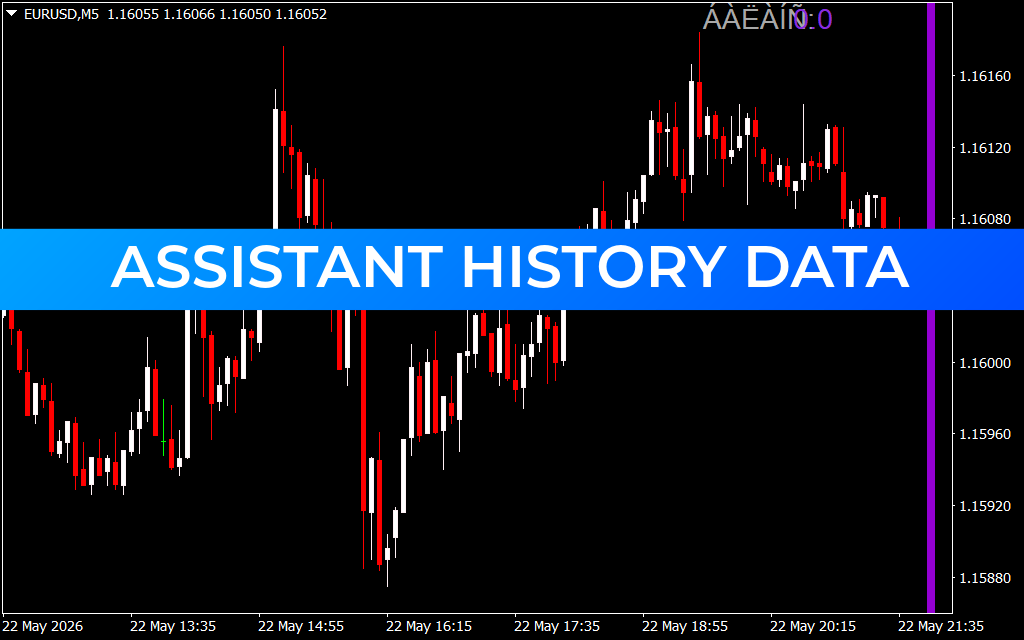
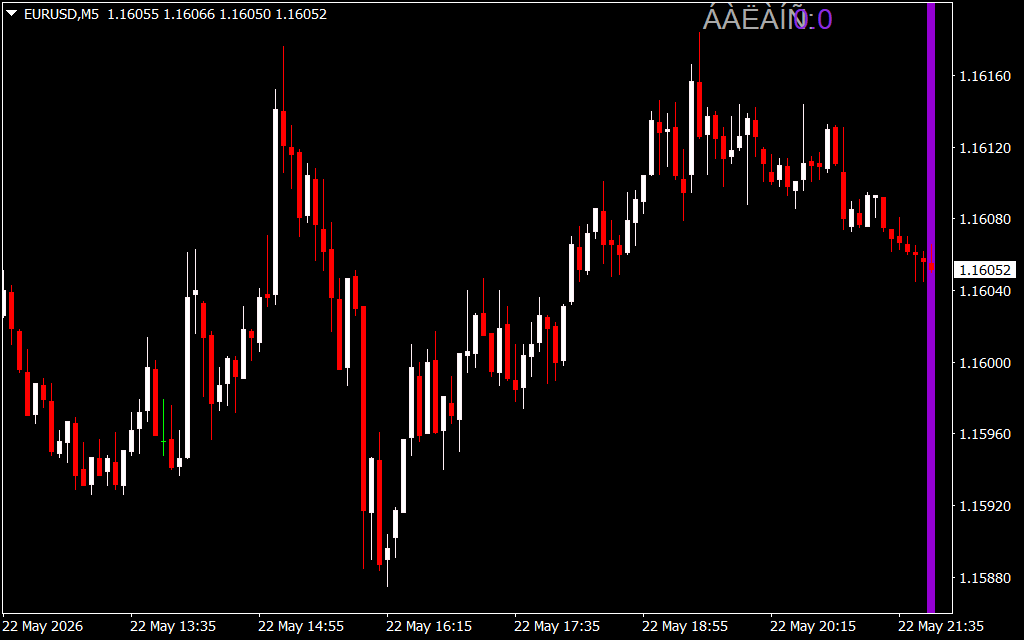
The Assistant History Data indicator operates as an analytical background tool. It works by injecting clear, programmatic visual markers—such as the vertical purple session boundary highlighted on the EURUSD M5 chart—directly onto your workspace. Instead of cluttering the chart with complex lines, it relies on clean vertical structures to separate distinct algorithmic delivery windows or historical execution intervals. This gives short-term scalpers and day traders an instant visual reference point for time-based market behavior.
Streamlining Post-Trade Analysis
One of the greatest hurdles for retail traders is overcoming emotional decision-making. By utilizing a historical reporting assistant on your charts, you gain access to an objective view of market structure.
- Time-of-Day Clarification: It allows you to immediately see if your setups perform better during high-volatility volume pockets or during quieter periods of consolidation.
- Correlating Price Action with Data: As shown in the attached chart, major liquidity runs and V-shaped reversals can be tracked precisely against historical time blocks. This makes it easier to backtest strategies based on session highs and lows.
- Uncluttered Interface: The indicator runs efficiently in the background, keeping price action clean and fully legible. This is crucial for traders tracking raw candlestick patterns, order blocks, or fair value gaps.
Enhancing Strategy Backtesting and Discipline
Whether you are executing a high-frequency Scalping strategy on the 5-minute (M5) chart or tracking multi-day swing positions, knowing the precise boundaries of historical data cycles helps eliminate trading outside your designated plan. The Assistant History Data indicator serves as a silent partner, handling the heavy lifting of back-end historical mapping so you can focus entirely on executing your edge, managing risk, and reviewing your performance with absolute mathematical clarity.
2 Downloads
Last Update:
May 24, 2026 01:54 AM
Published:
Jan 15, 2026 20:28 PM
Category: