Curiously, by default, MetaTrader 4 (MT4) does not include a built-in indicator that automatically plots Support And Resistance levels, even though these levels are crucial for technical analysis. Traders rely on them to identify price reaction zones, reversals, and potential breakout points.
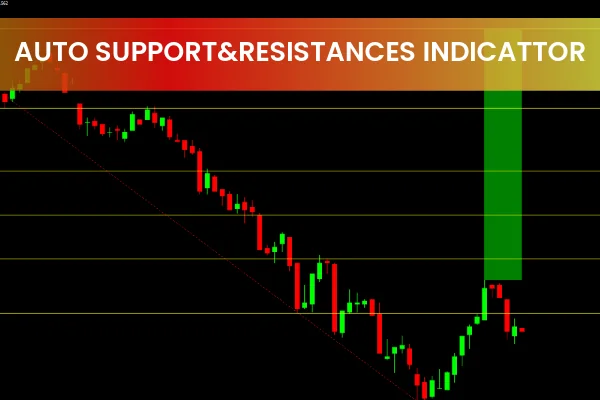
The Auto Support and Resistance MT4 Indicator solves this problem by automatically drawing support (blue zones) and resistance (red zones) on your chart. It’s designed to help both beginners and professional traders quickly visualize price boundaries and make informed decisions without manually marking every level.
What Is the Auto Support and Resistance MT4 Indicator?
The Auto Support And Resistance Indicator automatically identifies and displays significant support and resistance levels directly on the chart.
Support levels (blue zones): Indicate areas where buying pressure is likely to appear as prices drop.
Resistance levels (red zones): Indicate areas where selling pressure could emerge when prices rise.
This automation eliminates guesswork and manual plotting, helping traders save time and focus on executing trades. However, for new traders, it’s still valuable to learn manual level plotting to build experience and market understanding.
By combining automatic analysis with manual validation, you can enhance accuracy and develop a stronger feel for price behavior in the Forex market.
How the Indicator Draws Support and Resistance Levels
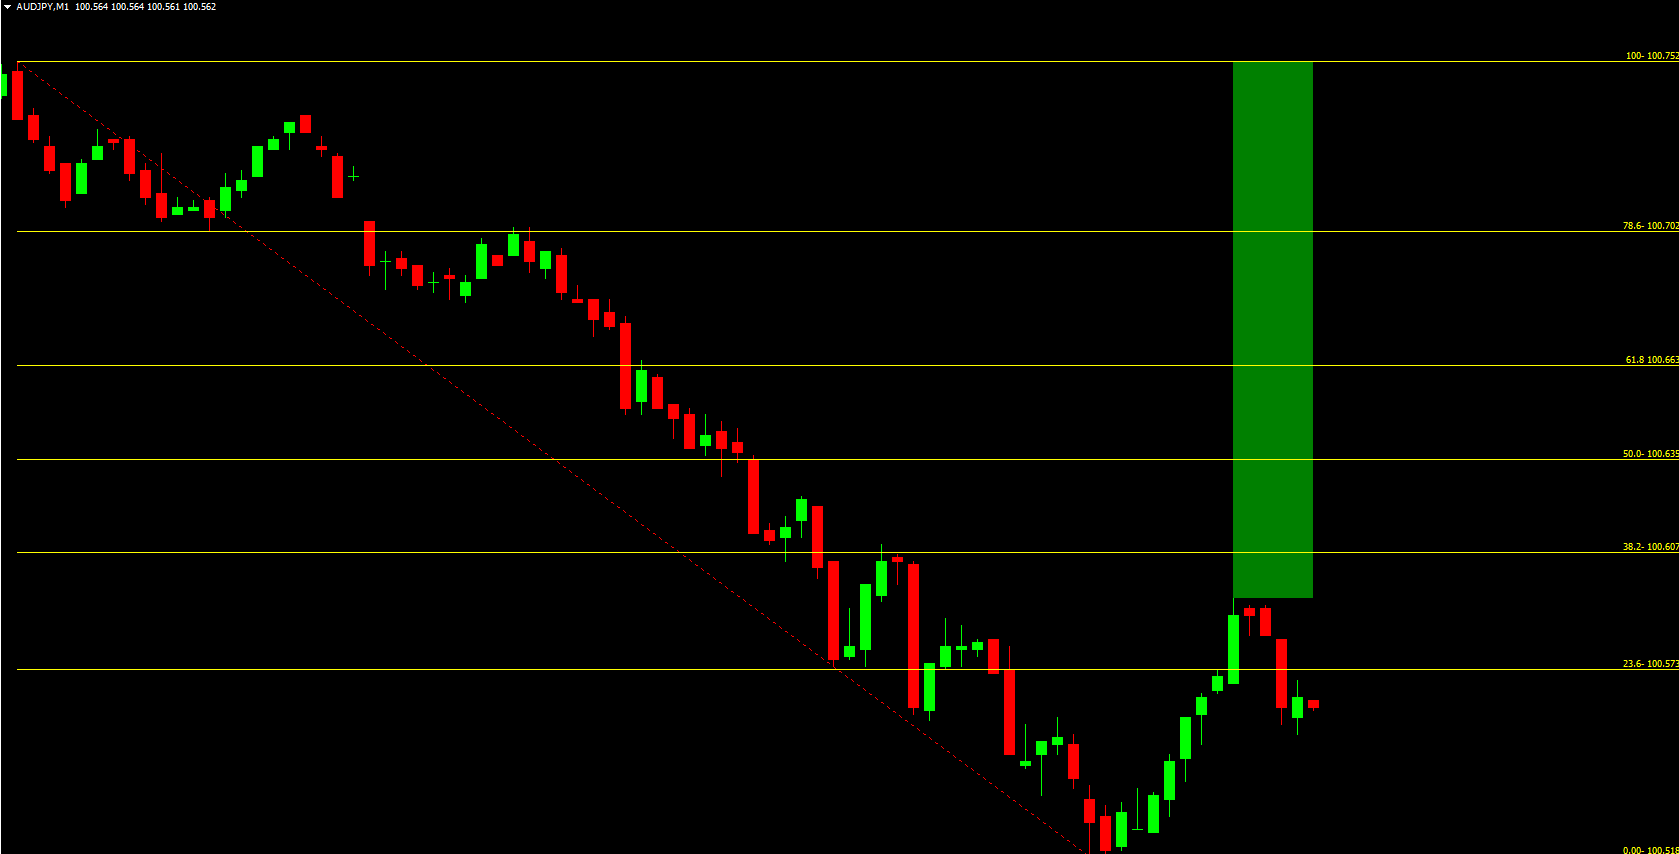
The Auto Support and Resistance MT4 Indicator uses market extrema (highs and lows) to identify and draw levels. These extrema are determined through the Fractals indicator, which is already integrated into the MT4 platform.
Here’s how it works:
The indicator identifies points on the chart where multiple fractals align — these points form strong levels.
The height of each level zone depends on the distance between the upper and lower fractals.
Wider distance: Higher level height, indicating stronger zones.
Closer distance: Lower level height, suggesting narrower or weaker zones.
When new fractals form, the indicator updates zone heights dynamically without redrawing past signals.
This ensures that your chart always reflects the most current and relevant levels without repainting or lagging.
How to Trade Using the Auto Support and Resistance Indicator
Trading Breakouts
Breakout strategies rely on price movements that cross significant support or resistance levels.
When the price breaks above a resistance zone, it can signal a potential buy opportunity.
When the price breaks below a support zone, it can indicate a sell opportunity.
For higher accuracy, combine this indicator with a trend-confirmation tool such as the AutoTrendLines Indicator. When both indicators align — for example, a breakout above resistance in an uptrend — it strengthens the trading signal.
Trading Rebounds
Rebound (bounce) trading involves entering trades when the price touches and reacts to a support or resistance zone without breaking it.
Buy near support zones when price shows signs of reversal upward.
Sell near resistance zones when price begins to turn downward.
This strategy works best during range-bound (flat) markets, where price oscillates between clear boundaries.
Example: Flat vs. Trend Markets
In flat markets, prices move horizontally between support and resistance levels. Traders can profit by buying at the lower limit (support) and selling at the upper limit (resistance).
In trending markets, support and resistance levels act as continuation zones:
During an uptrend, support zones provide good re-entry points for long positions.
During a downtrend, resistance zones offer ideal opportunities for short positions.
Using the Auto Support and Resistance MT4 Indicator alongside trend lines or moving averages increases your probability of catching profitable trades.
Benefits of the Auto Support and Resistance Indicator
Automatic level plotting: Save time by letting the indicator draw key levels for you.
Accurate, dynamic updates: Levels adjust in real time as Market Structure changes.
Clear visual display: Blue for support, red for resistance — simple and intuitive.
Compatible with all timeframes: Works on M1 to D1 charts for Scalping or swing trading.
Non-repainting: Once plotted, levels remain stable.
Free to download: Available now at IndicatorForest.com.
Conclusion
The Auto Support and Resistance MT4 Indicator is an indispensable tool for traders who value precision and efficiency. It automatically identifies major price zones, giving you an instant overview of market structure. Whether you trade breakouts or rebounds, this indicator can enhance your decision-making process.
For the best results, combine it with trend-following tools such as AutoTrendLines or Moving Average indicators. To download this powerful indicator and explore more professional Forex tools, visit IndicatorForest.com today.
FAQ
15 Downloads
Published:
Nov 11, 2025 00:43 AM
Category: