The Auto Trend Line Indicator for MT4 is a powerful tool built to automatically plot the most relevant and influential trend lines on a price chart. Instead of manually drawing lines that may be subjective or inconsistent, this indicator uses mathematical algorithms and filtering mechanisms to highlight only the trend lines that truly matter.
It adapts to market conditions in real time, adjusting the slope and removing outdated or invalid trend lines when trends shift. This ensures traders always view the most accurate representation of market direction, whether the market is trending upward, downward, or transitioning.
How the Auto Trend Line Indicator Works
Trend lines are fundamental components of technical analysis, helping traders identify market direction, breakout zones, and reversal points. However, drawing them manually can be error-prone. The Auto Trend Line Indicator solves this by using automated logic to detect swing highs, swing lows, and structural price points.
The indicator dynamically reacts to price movements. When the market changes direction, old trend lines are invalidated and removed, making space for updated lines that reflect the new structure. This keeps charts clean and ensures traders base decisions on current conditions rather than outdated setups.
Features of the Auto Trend Line Indicator for MT4
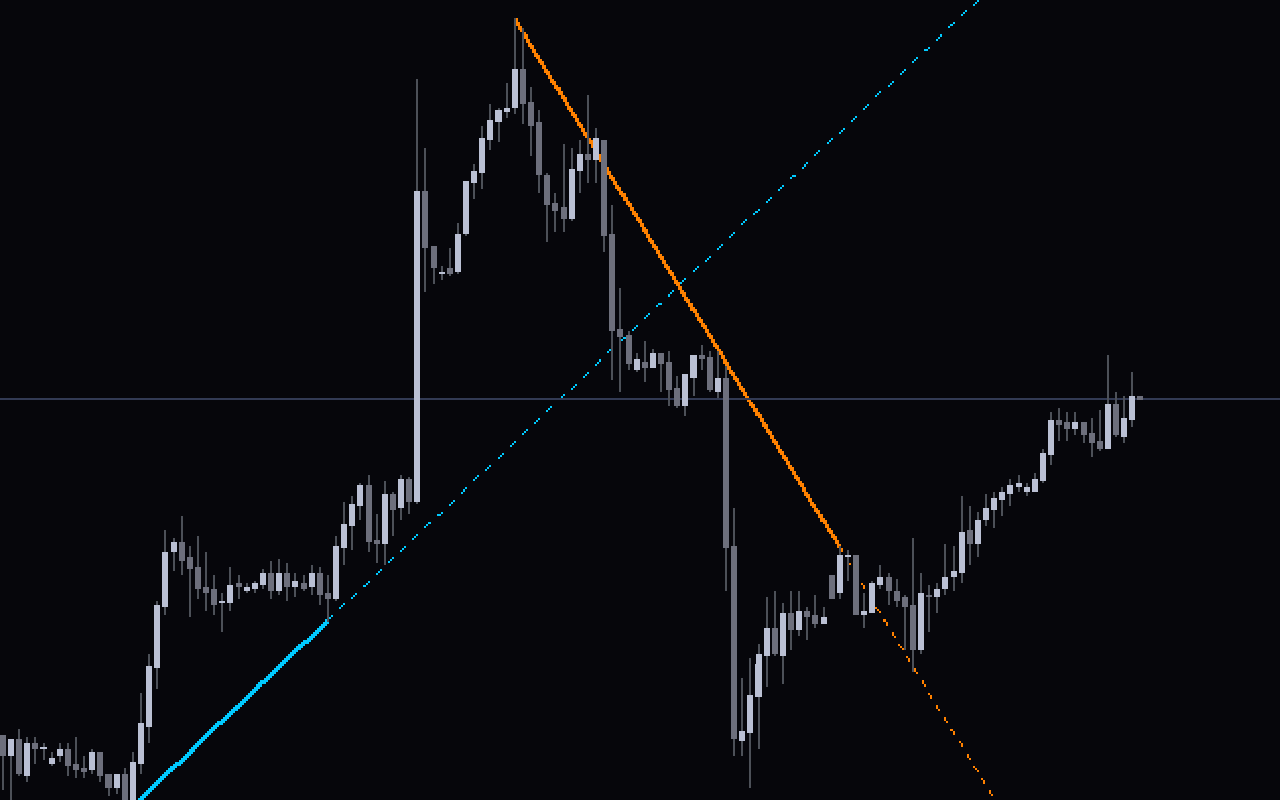
The indicator uses a color-coded system to differentiate various trend line types:
Blue Solid Line
Represents an active uptrend, showing where the price is consistently making higher lows.
Blue Dotted Line
Represents a projected or potential uptrend, helping traders anticipate future movement if current conditions continue.
Red Solid Line
Shows an active downtrend, indicating a sequence of lower highs and lower lows.
Red Dotted Line
Represents a projected downtrend, offering insight into possible bearish continuation.
By combining real-time and projected trend lines, the tool equips traders with a visual framework that supports decisions in both trending and corrective markets.
How the Indicator Can Benefit Your Trading
The Forex market is influenced by numerous variables such as global news, economic events, and unexpected market sentiment shifts. These factors often cause sudden volatility, leading to breakout scenarios or rapid reversals that can breach trend lines.
The Auto Trend Line Indicator takes these dynamics into account by:
Monitoring most price movements
Automatically updating trend lines during legitimate breakouts
Adjusting trend structure when markets reverse
This responsiveness allows traders to better interpret trend direction, breakout zones, and potential reversal levels without manually redrawing lines.
Why Traders Prefer Auto Trend Lines
The Auto Trend Line Indicator combines simplicity with high effectiveness. Both new and professional traders appreciate its ability to:
Reduce subjective decision-making
Provide a clearer interpretation of Price Action
Highlight potential entry and exit zones
Filter out noise and maintain only valid trend lines
Improve breakout and reversal accuracy
With its intuitive and adaptive design, the Auto Trend Line Indicator enhances market analysis and helps traders stay aligned with the current trend environment.
Conclusion
The Auto Trend Line Indicator for MT4 is an essential tool for traders who rely on trends, breakout levels, and price structure analysis. By automatically plotting accurate trend lines and adjusting them based on real-time market changes, it simplifies technical analysis and enhances decision-making.
For more premium MT4 and MT5 indicators, visit IndicatorForest.com and upgrade your trading toolkit today.
FAQ
2 Downloads
Published:
Dec 11, 2025 02:45 AM
Category: