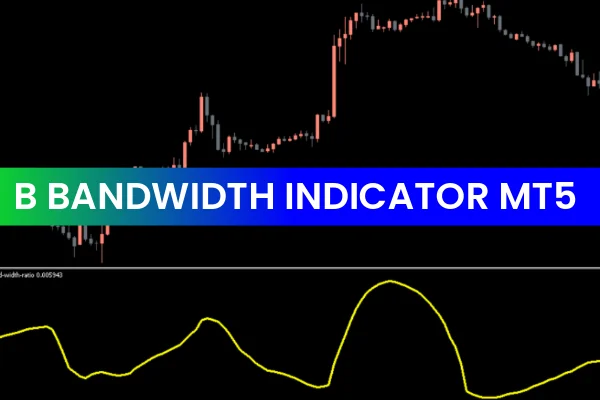
The B Bandwidth Indicator for MT5 is a powerful tool designed to measure market volatility using Bollinger Bands. In forex trading, understanding volatility is crucial for identifying potential price movements and setting effective trading strategies. By analyzing the distance between the upper and lower Bollinger Bands, traders can gauge when the market is consolidating or preparing for a breakout.
This article explores how the B Bandwidth Ratio Indicator for MT5 works, its benefits, and how traders can use it to anticipate market volatility.
What Is the B Bandwidth Ratio Indicator for MT5?
The B Bandwidth Ratio Indicator is based on the principles introduced by John Bollinger, the creator of Bollinger Bands. It calculates the distance (bandwidth) between the upper and lower Bollinger Bands and displays this value as a histogram or oscillator on your MT5 chart.
Higher volatility: Bands expand, showing a larger distance between the upper and lower lines.
Lower volatility: Bands contract, forming a narrow range or “squeeze” pattern.
When volatility decreases, it often precedes a major price movement. Hence, the indicator helps traders prepare for upcoming market shifts without predicting direction directly.
How Does the B Bandwidth Ratio Indicator Work?
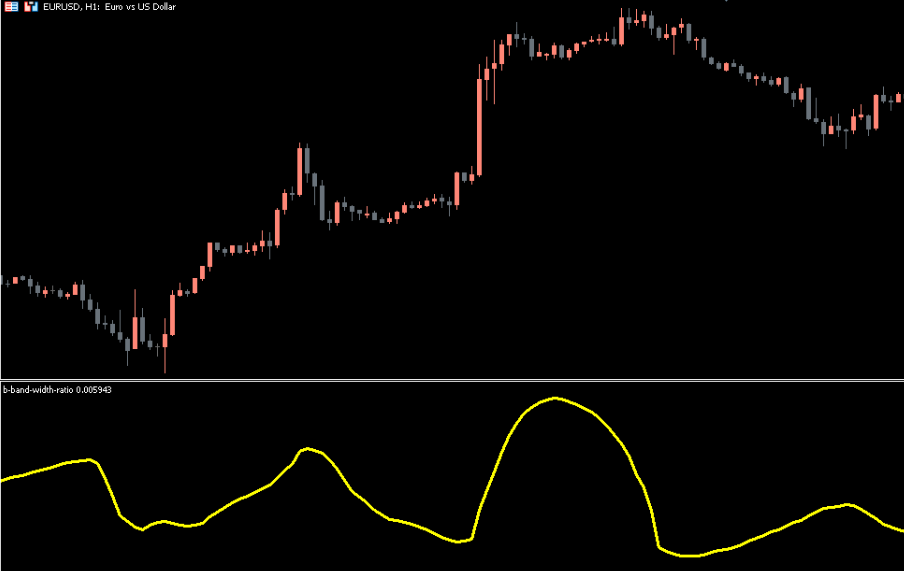
The indicator plots a yellow oscillator line that moves according to the relative distance between the Bollinger Bands. When the line falls to low levels, it signals a squeeze, indicating that volatility is minimal. When it rises, it shows that volatility has increased and that a breakout might be occurring.
Example:
A tight squeeze on the B Bandwidth Ratio indicator suggests that the market may soon experience a surge in volatility.
A wide bandwidth indicates that volatility is already high, and traders should manage their positions carefully.
Trading with the B Bandwidth Ratio Indicator
The B Bandwidth Ratio Indicator for MT5 does not generate buy or sell signals on its own. Instead, it provides context for traders to make informed decisions.
Here’s how to use it effectively:
Identify the squeeze pattern – Look for narrowing Bollinger Bands and low oscillator readings.
Prepare for breakout volatility – Once the squeeze forms, anticipate a potential expansion and adjust stop losses accordingly.
Combine with Price Action or other indicators – For confirmation, pair it with indicators like RSI or Moving Averages.
This approach helps traders manage risk, optimize entries, and understand when the market is transitioning from consolidation to expansion.
Why Forex Traders Use the B Bandwidth Ratio Indicator
Volatility awareness: Helps traders prepare for potential price surges.
Flexible across timeframes: Works seamlessly on intraday, daily, weekly, and monthly charts.
Integration-friendly: Complements Bollinger Bands-based strategies and automated trading systems.
Useful for beginners and experts alike: Easy to interpret and reliable in volatile conditions.
Whether you’re learning the basics of Bollinger Bands or fine-tuning your automated strategies, this indicator adds precision and confidence to your trading setup.
Practical Applications
Forex traders often use the B Bandwidth Indicator to:
Detect consolidation zones before major economic announcements.
Adjust stop-loss and take-profit levels based on volatility changes.
Avoid overtrading during quiet market phases.
Enhance algorithmic strategies that depend on volatility cues.
This makes it an essential part of a well-rounded trading toolkit.
Conclusion
The B Bandwidth Ratio Indicator for MT5 is a vital instrument for measuring volatility through Bollinger Bands. It helps traders identify market squeezes, anticipate explosive movements, and adapt their trading plans accordingly.
Whether you’re a novice or an experienced forex trader, mastering this indicator can elevate your trading precision. Explore and download the best forex indicators today at IndicatorForest.com and start improving your volatility analysis.
FAQ
Published:
Dec 09, 2025 10:53 AM
Category: