Master Volatility and Trend Breakouts with the KC Indicator for MT5
In the modern trading landscape, understanding the relationship between Price Action and volatility is the key to consistent profitability. While many traders rely on standard Bollinger Bands, the KC Indicator (Keltner Channels) for MetaTrader 5 (MT5) offers a more refined and robust alternative for identifying high-probability trend breakouts and exhaustion points. By utilizing an Average True Range (ATR) based formula rather than standard deviation, Keltner Channels provide a smoother, more reliable framework for navigating the volatile Forex and CFD markets.
The Superiority of ATR-Based Volatility
The KC Indicator consists of three primary lines: a central moving average and two envelope lines plotted above and below it. The critical difference lies in the calculation of the envelopes. While other indicators use simple price variance, the Keltner Channel uses the Average True Range (ATR) to determine the distance of the bands. This means the channels expand and contract based on actual market volatility, providing a more "organic" boundary for price movement.
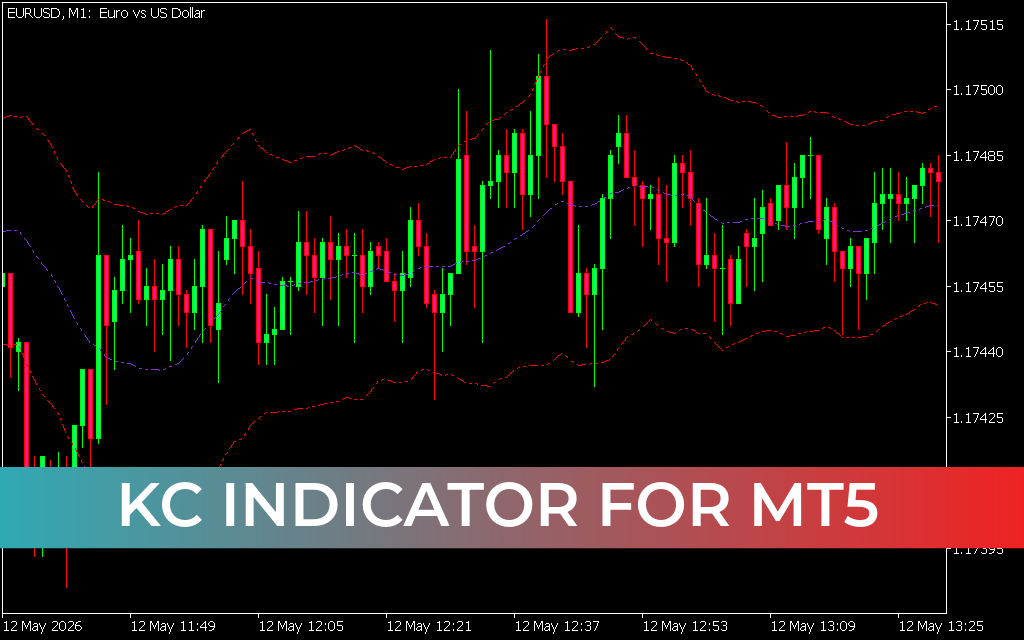
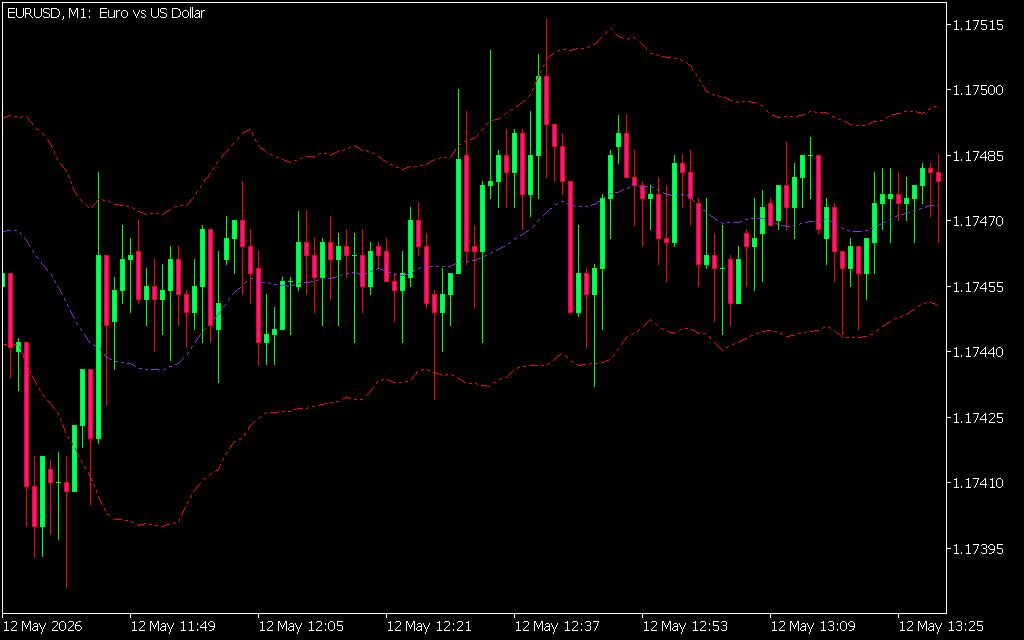
As seen in the EUR/USD M1 chart, the indicator provides a clear technical roadmap:
- The Median Line (Purple): Acts as the primary trend filter. When price remains consistently above this line, the market is in a bullish regime. Conversely, price action below the median indicates bearish dominance.
- Outer Volatility Bands (Red): These represent the statistical extremes of current price action. A candle closing outside these bands is often a signal of a powerful volatility breakout, marking the start of a major trend expansion.
- Dynamic Support And Resistance: During trending phases, the outer bands act as dynamic targets, while the median line serves as a structural support level where institutional "buy-the-dip" activity often occurs.
Tactical Trading Strategies with Keltner Channels
The KC Indicator is a versatile utility that fits multiple trading styles on the MT5 platform:
- Breakout Execution: One of the most profitable ways to use the KC indicator is to trade "squeezes." When the channels become narrow, it indicates low volatility. A sharp break outside the bands usually precedes a significant directional move.
- Identifying Overextension: In mean-reverting strategies, a touch of the upper or lower red band followed by a rejection candle can signal that a move is exhausted, providing an ideal entry for a counter-trend trade back to the median.
- Trend Following: Professional traders use the Keltner Channel to stay in winning trades. As long as price stays between the median and the outer band in the direction of the trend, the position is held, maximizing profit potential.
- Scalping on Lower Timeframes: On the M1 and M5 timeframes, the KC indicator successfully filters out "noise," allowing scalpers to identify high-velocity momentum shifts with surgical precision.
Conclusion
The KC Indicator for MT5 is an essential tool for any trader looking to quantify market volatility and Trend Strength. It replaces subjective guesswork with mathematical boundaries, allowing you to visualize where the market is likely to stall and where it is likely to explode. By integrating this professional-grade volatility envelope into your technical arsenal, you gain
Last Update:
May 12, 2026 17:13 PM
Published:
Jan 23, 2026 12:48 PM
Category: