Mastering Market Trends with the MTF MACD Bar Indicator
In the fast-paced world of technical analysis, the Moving Average Convergence Divergence (MACD) remains one of the most trusted momentum oscillators. However, standard MACD displays can often clutter a chart or fail to provide the broader perspective needed for high-probability trading. Enter the MTF MACD Bar Indicator, a sophisticated tool designed to bring multi-timeframe (MTF) clarity to your Price Action analysis.
Understanding the MTF MACD Bar Advantage
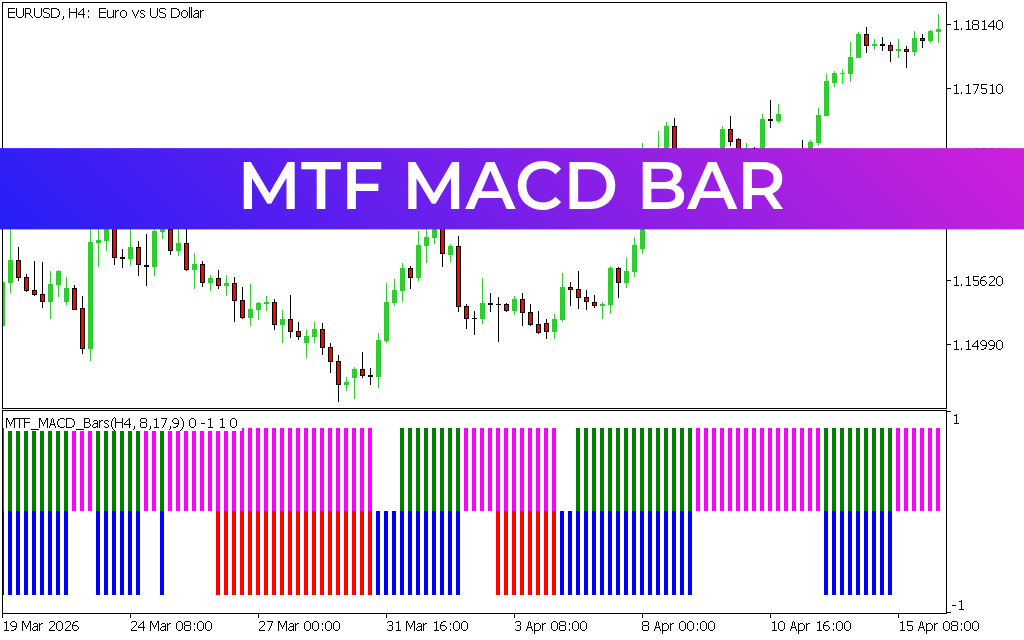
The MTF MACD Bar indicator transforms the traditional MACD histogram into a clean, color-coded bar system located in a dedicated sub-window. The "MTF" component is the real game-changer: it allows traders to view the MACD status of higher timeframes (such as H4 or Daily) directly on a lower timeframe chart (like M15 or M30).
This top-down approach ensures that you are always aware of the dominant market trend. Trading in the direction of a higher-timeframe MACD signal significantly reduces the risk of being caught in "market noise" or minor counter-trend pullbacks.
Key Features and Visual Interpretation
As seen in the uploaded EURUSD H4 chart, the indicator uses a multi-color bar system to represent different market conditions:
- Momentum Confirmation: The vertical bars fluctuate between bullish and bearish states. Typically, colors like green or blue indicate upward momentum, while red or magenta signal downward pressure.
- Dual-Layer Analysis: The indicator often displays multiple rows of bars. This allows you to track the MACD crossover and the signal line status simultaneously, or even track two different timeframes at once.
- Clean Workspace: By moving the MACD data into a compact bar format, your main chart remains clear for identifying Candlestick Patterns, support/resistance levels, and supply/demand zones.
Strategic Implementation
To maximize the effectiveness of the MTF MACD Bar indicator, traders often employ a "confluence" strategy. For example, if the Daily MTF MACD Bar is green (bullish), a trader would look for a corresponding green bar on the H4 or H1 chart to initiate a long position.
This synchronization ensures that both short-term momentum and long-term trend are aligned. Additionally, the indicator is excellent for identifying divergence. If the price is making higher highs but the MTF MACD Bars are failing to reach new peaks, it serves as a powerful warning of a potential Trend Reversal.
Conclusion
The MTF MACD Bar is an indispensable tool for traders who value systematic decision-making. By providing a multi-dimensional view of momentum without overcomplicating the visual field, it helps you stay disciplined and focused on high-probability setups. Whether you are a scalper looking for quick momentum bursts or a swing trader following the institutional flow, this indicator provides the edge needed in today’s markets.
4 Downloads
Last Update:
May 09, 2026 11:56 AM
Published:
Jan 25, 2026 12:41 PM
Category: