The Balance of Power Indicator for MT4 is a powerful technical analysis tool used to measure the strength of buying and selling pressure in the market. By calculating the relationship between the opening, closing, high, and low prices, the indicator reveals whether bulls or bears currently dominate Price Action. This makes it highly reliable for identifying trend direction, momentum shifts, and potential reversal points. Traders across all experience levels use this tool to enhance decision-making, reduce emotional bias, and gain an objective view of market conditions.
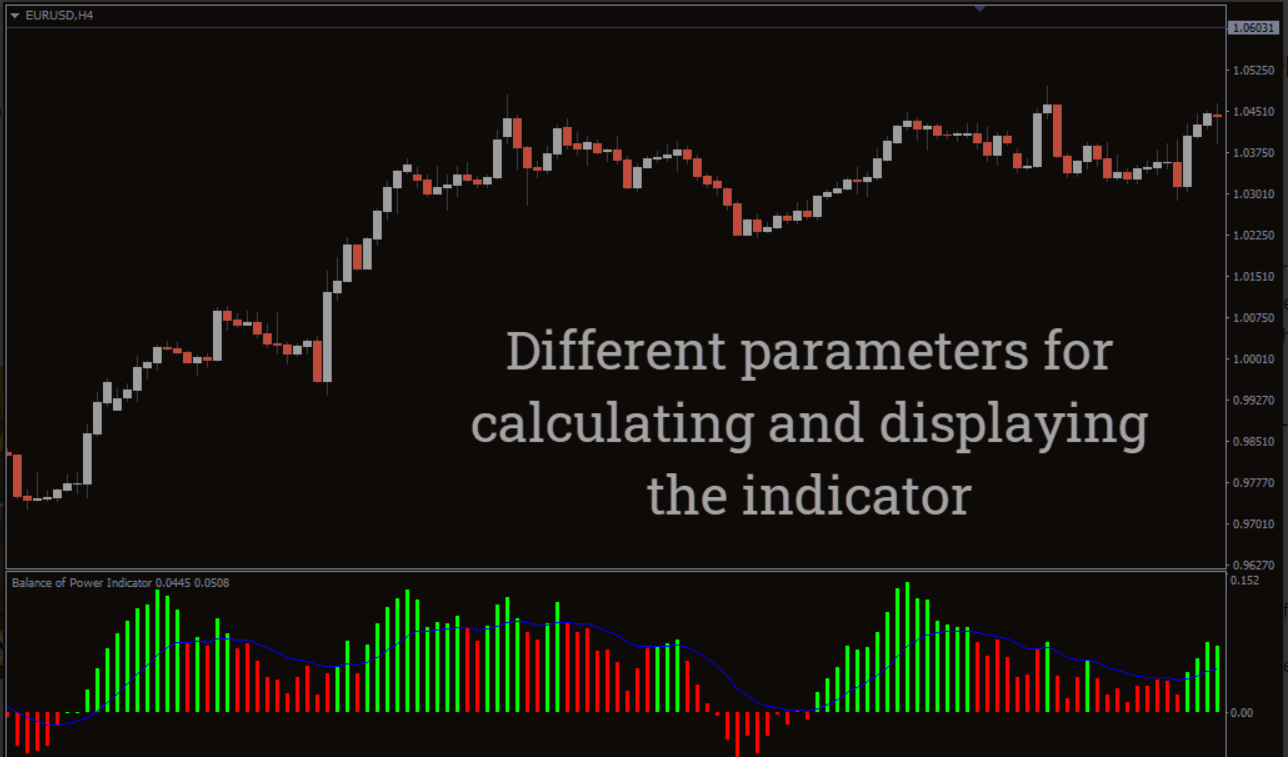
At its core, the indicator uses the formula (Close – Open) / (High – Low) to compute its value. The resulting data is presented as a histogram that oscillates above and below the zero line. Positive (lime) bars indicate strong bullish pressure, while negative (red) bars suggest dominant bearish activity. A built-in 14-period moving average smooths the histogram and makes trend behavior easier to interpret. Because of its simplicity and clarity, the Balance of Power Indicator for MT4 is a favorite tool among scalpers, intraday traders, and swing traders.
How the Balance of Power Indicator for MT4 Works
Bullish and Bearish Pressure Measurement
The indicator visually compares market forces:
Lime histogram bars above zero → bulls are in control
Red histogram bars below zero → bears dominate
The stronger the bar deviates from zero, the more aggressive the market participants.
This color-coded display helps traders instantly understand market sentiment without needing multiple indicators or complex analysis tools.
Identifying Trend Bias
The zero line acts as a trend filter.
When histogram bars stay above zero, the market has a bullish bias.
When histogram bars remain below zero, the market is bearish.
This makes the Balance of Power Indicator for MT4 extremely useful for Trend Continuation and trend reversal strategies.
How to Trade With the Balance of Power Indicator
Buy Signals
A high-probability buy setup occurs when:
Lime histogram bars rise above the zero line.
Price forms a bullish candlestick pattern such as a bullish engulfing setup.
Momentum shifts in favor of buyers as seen in both price action and indicator data.
This confirmation process helps avoid false signals and improves timing.
Sell Signals
A valid sell opportunity appears when:
The indicator shows red histogram bars below the zero level.
Price aligns with a bearish structure or a bearish engulfing pattern.
The overall trend favors sellers, confirming downward pressure.
This combination of candlestick analysis and indicator data makes trading setups clearer and more reliable.
Useful for All Trading Styles
The Balance of Power indicator adapts well to:
Scalping on lower timeframes
Day trading during active sessions
Swing trading major price movements
Its versatility is one of the reasons it remains popular among technical traders.
Why Use the Balance of Power Indicator for MT4?
Evaluates Market Strength Objectively
Unlike many subjective indicators, the Balance of Power uses pure price data. This makes it more reliable in fast-moving markets.
Enhances Trend and Reversal Detection
Because it identifies early shifts in momentum, it can signal potential reversals before price changes direction.
Works on All Forex Pairs and Instruments
You can apply it to forex, metals, indices, stocks, and cryptocurrencies available on MetaTrader 4.
Conclusion
The Balance of Power Indicator for MT4 is a highly effective tool for evaluating buying and selling strength and revealing market sentiment. It helps traders identify overbought or oversold conditions, trend continuation, and Trend Reversal setups with ease. Whether you trade short-term or long-term, this indicator can improve your technical analysis and increase your confidence in trade entries.
Download the Balance of Power indicator today and enhance your trading accuracy. For more MT4 and MT5 tools, visit IndicatorForest.com.
FAQ
1 Download
Published:
Nov 16, 2025 02:50 AM
Category: