Mastering Market Geometry with the VR Figura Indicator for MT4/MT5
In technical analysis, the ability to identify price patterns and Market Structure is what separates professional traders from amateurs. However, manually drawing trendlines and identifying legs can be subjective and time-consuming. The VR Figura indicator is a powerful automated solution for MT4 and MT5 that maps out market geometry in real-time, allowing traders to visualize the skeleton of Price Action with clinical precision.
What is the VR Figura Indicator?
The VR Figura is a professional-grade technical tool designed to detect and draw price movements based on swings in the market. By connecting significant highs and lows, the indicator creates a visual representation of the market's "breathing"—its impulses and corrections.
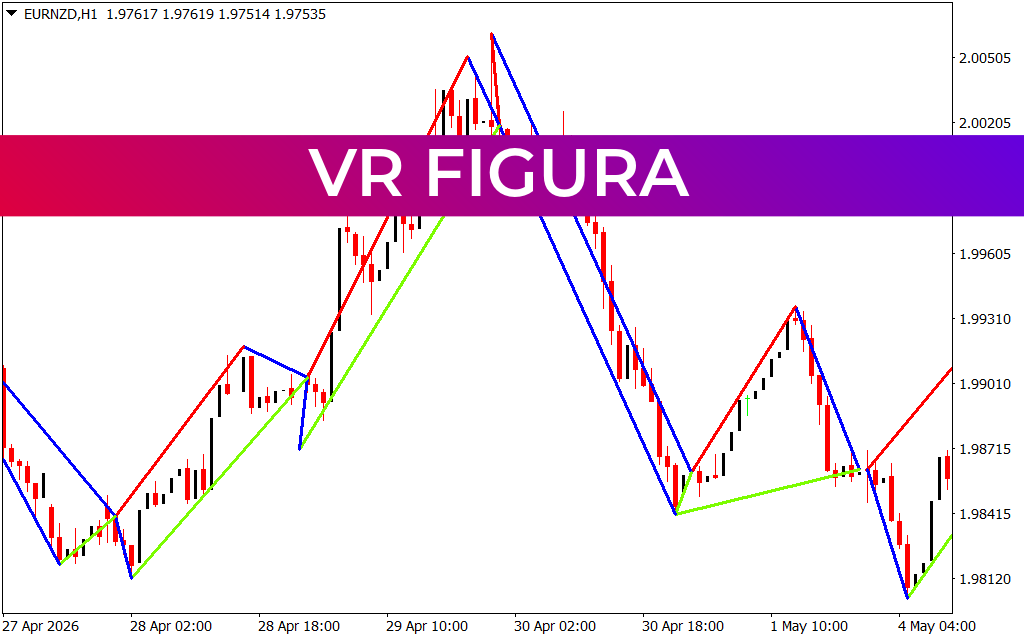
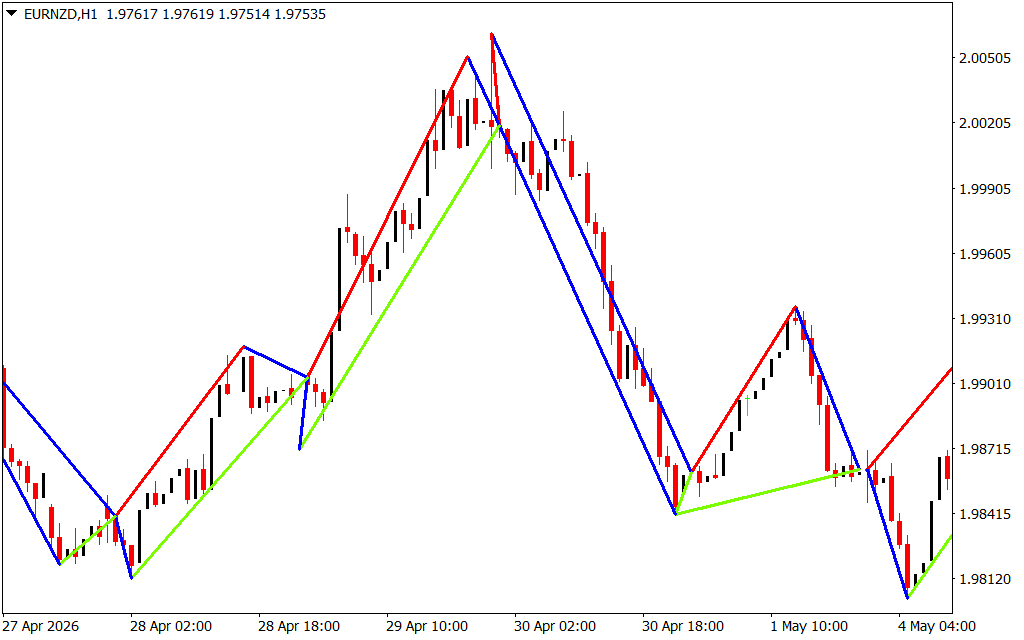
As seen in the EURNZD chart, the indicator uses a multi-color system to categorize price legs:
- Red Lines: Typically represent bullish impulse legs or upward price swings.
- Blue Lines: Generally indicate bearish impulse legs or downward price swings.
- Green Lines: Often represent corrective phases or secondary trendlines that provide a baseline for the current market structure.
Key Benefits of Automated Pattern Recognition
- Eliminates Subjectivity: One of the biggest hurdles in trading is "seeing what you want to see." VR Figura uses a fixed mathematical algorithm to plot lines, ensuring your analysis remains objective and consistent across all timeframes.
- Identifies Market Structure: By clearly marking highs and lows, the indicator helps traders instantly identify if a market is in a state of expansion (making higher highs and higher lows) or contraction.
- Visualizes Breakouts: When price decisively breaks a line plotted by VR Figura, it signals a potential change in market sentiment. This is a primary entry signal for many trend-following and price action strategies.
- Perfect for Multi-Timeframe Analysis: Whether you are Scalping on the M1 or swing trading on the H1, the VR Figura adapts to the volatility of the specific timeframe, providing a clear map of the current trend.
How to Trade with VR Figura
Most traders use VR Figura as a foundational layer for their strategy. For instance, in a bullish trend marked by red impulse lines, a trader might look for price to pull back to a green corrective line before entering a "buy" position. This allows for high-reward entries with very tight stop-losses placed just beyond the structure marked by the indicator.
Furthermore, VR Figura is excellent for identifying classic patterns like Head and Shoulders, Double Tops, and Triangles. Because the indicator does the heavy lifting of drawing the legs, the trader can focus on the most important part: executing the trade when the pattern completes.
Conclusion
The VR Figura indicator is more than just a drawing tool; it is a structural analysis system. By providing a clear, geometric view of the market, it empowers traders to follow the path of least resistance. Add this essential tool to your trading terminal today and start seeing the market through the lens of professional geometry.
2 Downloads
Last Update:
May 09, 2026 00:48 AM
Published:
Jan 25, 2026 16:42 PM
Category: