Master Market Sentiment with the Bears Vs Bulls Indicator
In the financial markets, price movement is driven by a continuous tug-of-war between two opposing forces: buyers who push prices higher and sellers who drive them lower. For intraday traders navigating highly liquid currency pairs like the EUR/USD, entering a trade without knowing which side currently controls the market can lead to costly traps. Standard oscillators often generate conflicting signals during swift momentum shifts. The Bears Vs Bulls indicator provides a definitive solution by visualizing the exact balance of power in real time.
What is the Bears Vs Bulls Indicator?
The Bears Vs Bulls indicator is a specialized volume and sentiment oscillator engineered for MetaTrader platforms. It modernizes classic market-power formulas—such as Alexander Elder’s Bull Power and Bear Power metrics—and refines them into a single, intuitive structural tracking tool.
Instead of cluttering your main window with overlapping moving averages or forcing you to monitor multiple separate indicator screens, this software evaluates the relationship between the active session's price extremes and an underlying exponential value baseline. It subtracts the moving average from the session high to determine absolute buying capacity, and subtracts it from the session low to isolate true selling intensity. The resulting data points are compiled into a highly responsive, real-time momentum histogram.
Key Visual Features and Technical Benefits
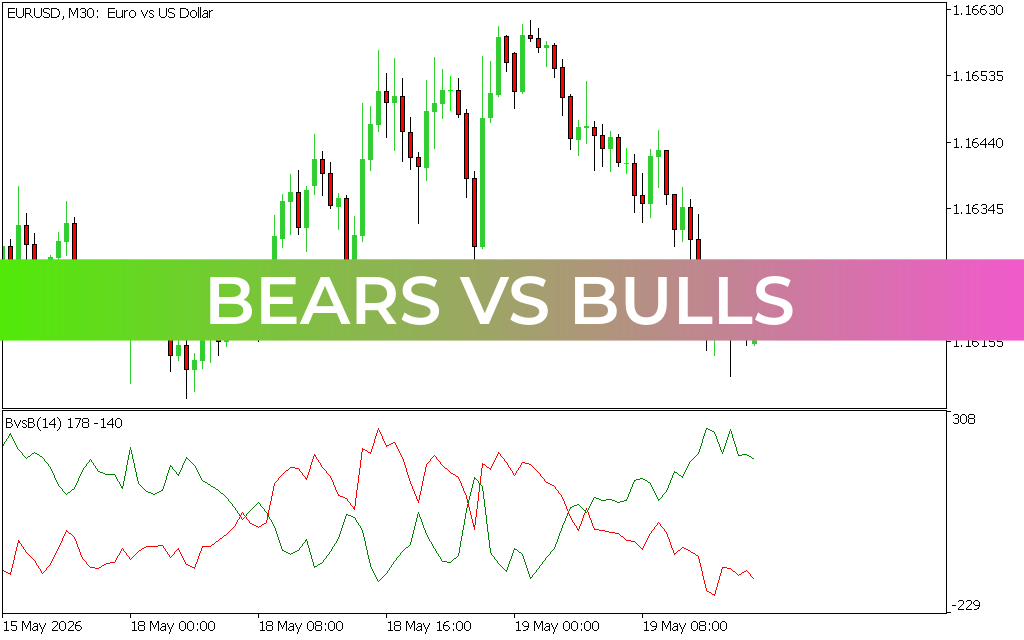
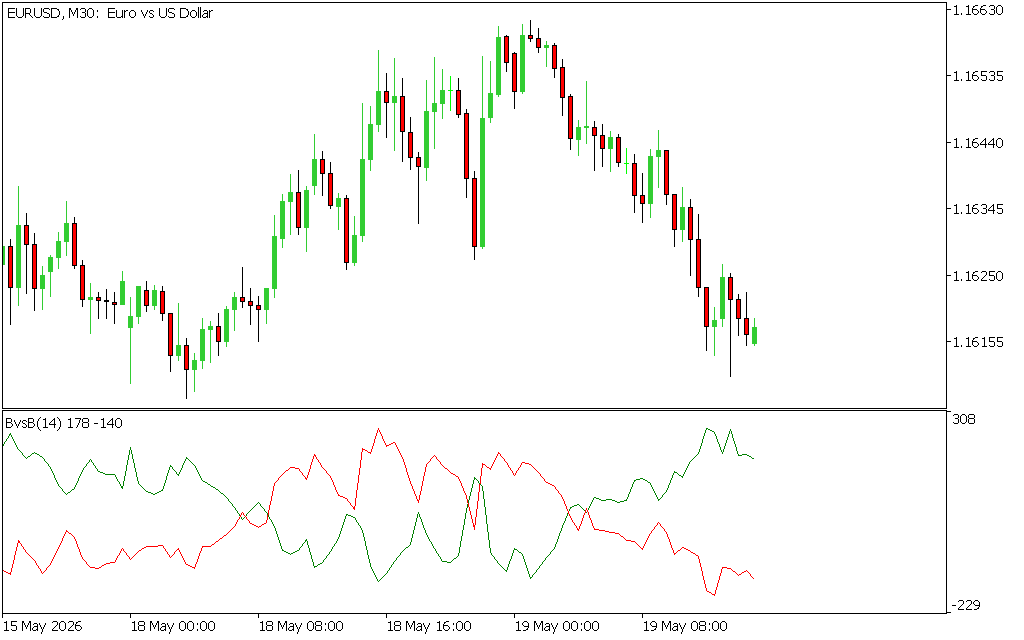
- Dual-Color Power Matrix: The indicator simplifies complex market sentiment by plotting a continuous vertical histogram in a dedicated sub-window. Green bars signify expanding buyer dominance, while red bars confirm that aggressive short-sellers have seized control.
- Zero-Line Equilibrium Crossing: The 0.00 baseline serves as the ultimate structural axis of power. When the histogram bars cross decisively over this line, it tracks a major sentiment shift, allowing you to catch trend changes early on timeframes like the 30-minute (M30) chart.
- Filtering Noise and False Breakouts: By revealing the true strength behind a price push, the indicator prevents you from buying into weak breakouts or selling during low-volume pullbacks.
- Clean Sub-Window Design: Keeping the workspace beneath your main candles ensures your core screen remains empty, giving you room to draw manual support zones, order blocks, or trendlines.
How to Trade with the Bears Vs Bulls Indicator
Trading effectively with this tool centers on entering positions right as institutional volume validates a definitive shift past the center equilibrium.
- Bullish Momentum Configuration: Watch the sub-window during a corrective decline or a period of horizontal consolidation. The moment the histogram bars flip from red to green and expand decisively above the 0.00 axis, aggressive buyers are entering the market. Execute a buy order at the candle close, setting a stop-loss tightly below the recent local swing low.
- Bearish Momentum Configuration: Conversely, when price rallies into a major historical resistance zone and the histogram bars crash below the 0.00 zero-line, selling velocity has won the tug-of-war. Open a short entry to ride the ensuing downward impulse leg.
Take the guesswork out of market sentiment analysis by downloading the Bears Vs Bulls indicator today to trade with systematic clarity.
1 Download
Last Update:
May 19, 2026 17:05 PM
Published:
Jan 19, 2026 19:17 PM
Category: