Master the Daily Range: Breakout Box 5 Daily Candles Ocbox for MT4
In the financial markets, major institutional moves rarely happen at random. Big banks, hedge funds, and market makers heavily rely on the previous day's high, low, and median price points to plan their next block orders. For retail day traders, failing to map out these critical structural milestones means trading completely blind. If you want to capture explosive market extensions and avoid brutal bull and bear traps, you need an automated visual solution. The Breakout Box 5 Daily Candles Ocbox for MT4 is a premium, institutional-grade chart overlay designed to map daily price boundaries with flawless accuracy.
Instead of wasting precious time at the start of every trading day manually drawing horizontal lines that clutter your screen, this highly efficient indicator does the heavy lifting for you. It groups historical intraday Price Action into clean, structured daily intervals, giving you an immediate competitive edge.
The Anatomy of the Daily Ocbox Breakdown
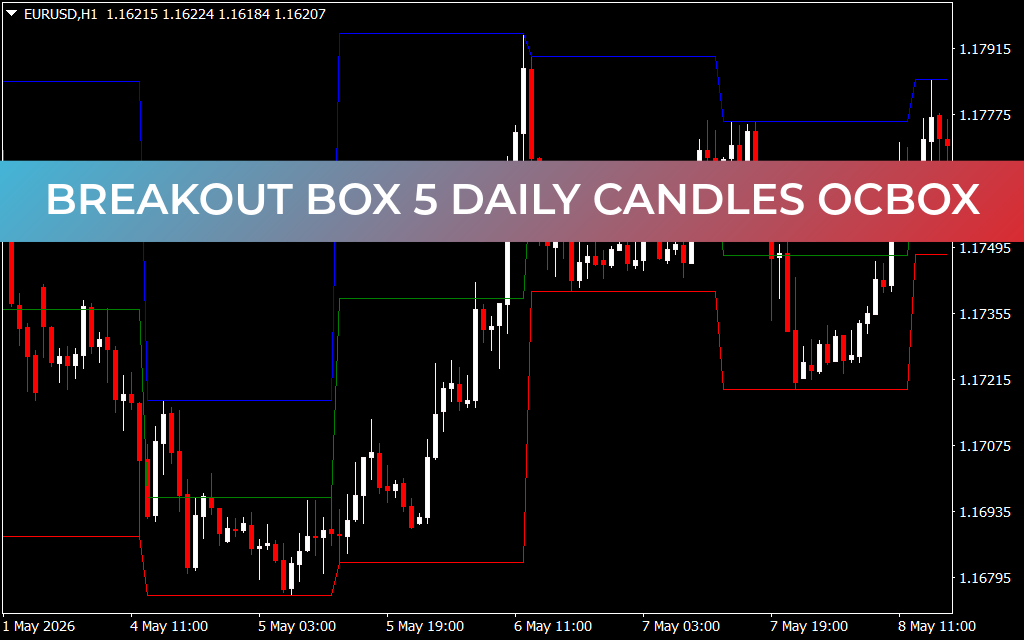
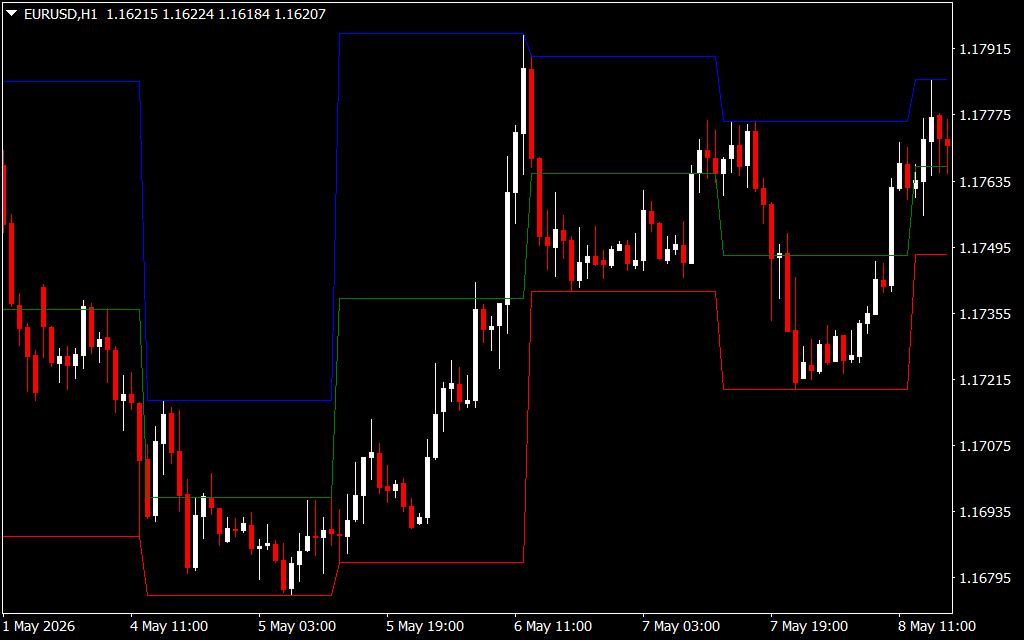
When loaded onto a highly liquid asset like the EUR/USD on the 1-hour (H1) chart, the indicator plots three distinct, mathematically backed horizontal lines that adapt dynamically at the start of every new daily candle:
- The Blue Upper Boundary (Daily High): This line locks in the highest price point achieved during the previous trading session. A sustained hourly candle close above this blue line confirms a powerful bullish breakout, signaling a massive influx of buyers and opening the door for trend-continuation trades.
- The Red Lower Boundary (Daily Low): This line represents the absolute floor of the prior day's price action. When institutional sellers push the market below this red baseline, it signals a major structural breakdown, alerting day traders to aggressively hunt for short positions.
- The Green Central Equilibrium (Daily Median): Running directly through the center of the daily range is the green line. This acts as the ultimate fair-value pivot point. If the price is trading above the green line, bulls hold the intraday micro-bias; if it hovers below, the bears maintain localized control.
Streamlining Your Breakout and Mean-Reversion Strategies
The Breakout Box 5 Daily Candles Ocbox indicator shines because it serves two completely different types of trading styles simultaneously. For high-velocity breakout traders, the sudden expansion of a daily candle past the blue or red boundary lines provides immediate confirmation to jump into a trade as momentum accelerates.
Conversely, for mean-reversion or range traders, these lines represent the ultimate overextended extremes. When the price tests the outer red or blue lines in a low-volatility environment and prints a rejection candlestick pattern, it gives you a high-probability signal to trade the market back toward the central green equilibrium line. By turning raw, messy price feeds into a highly organized, actionable visual roadmap, this MT4 tool ensures you always trade with institutional structure on your side.
1 Download
Last Update:
May 17, 2026 16:11 PM
Published:
Jan 20, 2026 21:18 PM
Category: