Volume is one of the most powerful yet overlooked components in technical analysis. While price tells you what the market is doing, volume reveals how strong that movement really is. The Buy Sell Volume Indicator for MT5 helps traders identify bullish and bearish strength by comparing buying versus selling pressure in real time.
Instead of giving direct buy or sell signals, this indicator works as a Trend Strength filter, allowing traders to confirm whether a breakout, pullback, or continuation move is backed by solid volume. That makes it a valuable addition to any strategy—whether you trade Forex, stocks, indices, or commodities.
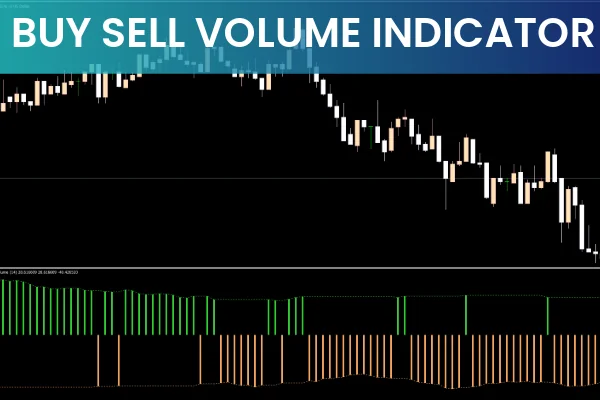
How the Buy Sell Volume Indicator Works
The Buy Sell Volume indicator displays two main components:
Green dotted line + green histogram → Bullish volume
Orange dotted line + orange histogram → Bearish volume
These visual cues help traders quickly determine whether buyers or sellers are dominating the market at any given time.
Bullish Volume (Green)
When the green histogram rises upward:
Buying pressure is increasing
Bulls are gaining control
A bullish breakout or continuation becomes more likely
This helps traders identify long setups backed by genuine demand.
Bearish Volume (Orange)
When the orange histogram trends downward:
Selling pressure is rising
Bears are taking control
A bearish breakout or trend continuation is likely
This provides clarity when looking for short opportunities.
How to Trade With the Buy Sell Volume Indicator on MT5
Breakout Confirmation
Volume is one of the best tools for breakout confirmation.
In the EURUSD example discussed, the pair consolidated after a bullish move. During the consolidation:
The green Buy Sell volume curve increased slightly
This suggested bullish pressure was quietly building
Price eventually broke upward
The histogram turned green, confirming volume-backed breakout strength
Use this method to avoid false breakouts and trade only the ones supported by increasing volume.
Bearish Breakout Setup
To confirm a sell opportunity:
The histogram should turn orange
The orange dotted line should begin falling
Price should break below a support or consolidation structure
When Price Action and volume move in the same direction, the breakout is more reliable.
Trend Following with Volume Strength
The Buy Sell Volume indicator also excels in trend-following strategies.
Example:
Price is making higher lows in a bullish trend
The indicator turns green and rises during the pullback
This signals strong buying pressure
Traders may enter long positions with a favorable risk-to-reward ratio
In downtrends, the same logic applies with orange bearish volume.
Why Volume Matters in Forex and Stocks
Volume is essential because it confirms:
Commitment of buyers or sellers
Strength behind breakouts
Whether a trend is likely to continue or fail
Times of accumulation or distribution
Without volume confirmation, many trades rely solely on price behavior—which can be misleading during low-liquidity phases. That’s why the Buy Sell Volume indicator is especially helpful for beginners needing clear visual guidance.
Conclusion
The Buy Sell Volume Indicator for MT5 gives traders an intuitive, color-coded view of market demand. Whether you’re trading breakouts, pullbacks, or trend continuations, volume strength is a critical factor for making informed decisions. This indicator is simple, powerful, and beginner-friendly—making it an excellent choice for traders seeking improved accuracy through volume analysis.
For more premium and free indicators, visit IndicatorForest.com.
FAQ
1 Download
Published:
Nov 23, 2025 12:31 PM
Category: