Navigate Volatility with Precision Using the BZ Tl Skyline Indicator
In the rapidly shifting environment of the Forex and CFD markets, understanding the boundary between a standard price fluctuation and a significant breakout is vital for success. The BZ Tl Skyline Indicator is an advanced technical analysis tool for MetaTrader designed to map out these critical boundaries. By combining dynamic price channels with fixed horizontal breakout levels, this indicator provides traders with a comprehensive "skyline" view of Market Structure, allowing for more disciplined entries and better risk management.
The Logic of BZ Tl Skyline
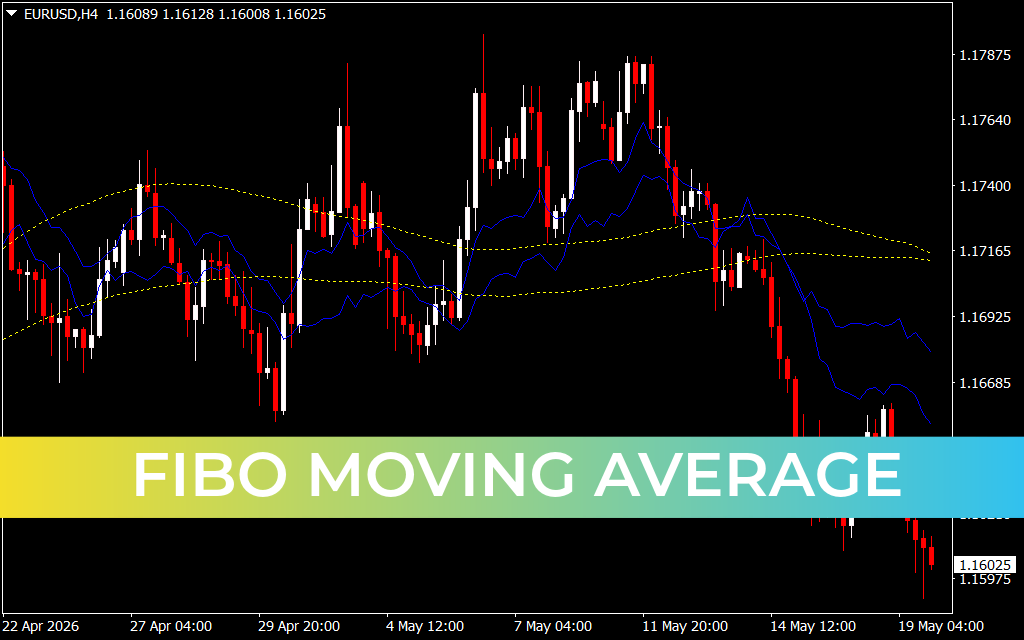
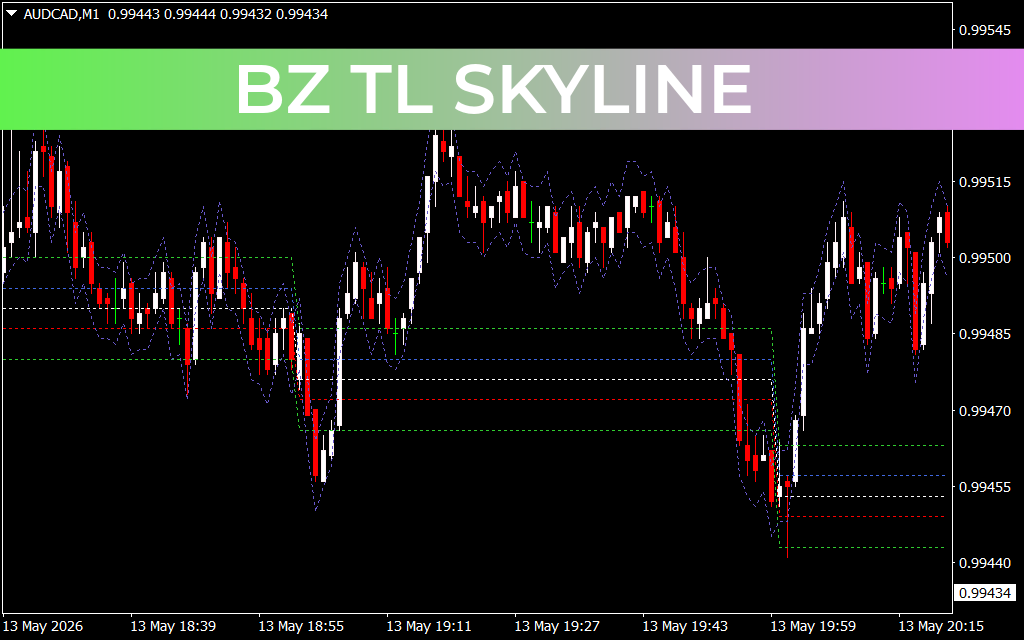
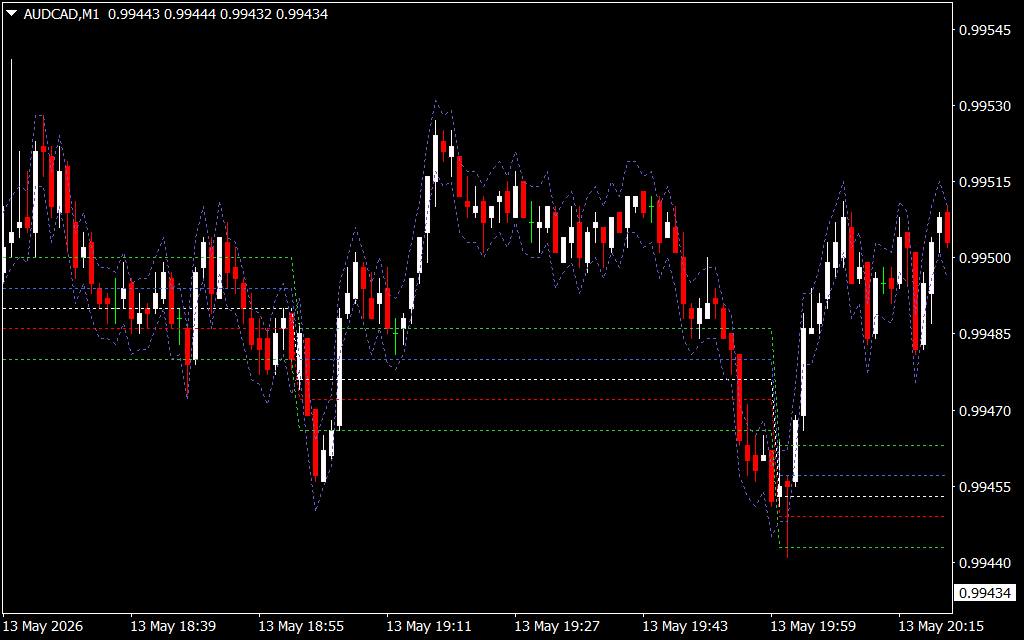
The BZ Tl Skyline indicator operates on a dual-logic system that addresses both trend and range. As seen in the AUD/CAD M1 chart, the indicator features a wavy, dynamic channel (the "TL" or Trend Line component) that hugs the Price Action. This channel acts as a volatility envelope, helping traders identify when the price is overextended relative to its recent mean.
Complementing this is the "Skyline" component—the distinct horizontal stepped lines in green, blue, white, and red. These levels represent calculated institutional Support And Resistance zones. When the price action moves from one horizontal "step" to another, it signals a shift in the market's value area. These levels are particularly effective at identifying breakout points where momentum is likely to accelerate.
Key Features and Strategic Advantages
- Multi-Layered Support and Resistance: Unlike standard pivot points, the Skyline levels are dynamic and adjust based on recent price extremes. This provides a more accurate representation of where the "floor" and "ceiling" of the market currently sit.
- Volatility Envelopes: The dashed outer bands provide a clear visual of market volatility. If the price pierces the outer band while simultaneously breaking a horizontal Skyline level, it provides a high-confluence signal for a potential Trend Reversal or a major breakout.
- Visual Structure for Scalpers: For traders operating on the 1-minute (M1) or 5-minute (M5) timeframes, the horizontal steps offer clear targets for Take Profit (TP) and logical locations for Stop Loss (SL) orders.
- Breakout Confirmation: The indicator excels at identifying "fakeouts." A move that fails to close above a horizontal Skyline level is often a sign of exhaustion, protecting the trader from entering at the very end of a move.
Application in Day Trading
The BZ Tl Skyline is most effective when used to trade the "inter-level" moves. For example, on the provided AUD/CAD chart, notice how the price often consolidates between the blue and white horizontal lines before making a decisive move toward the red or green boundaries. A trader can wait for a candle to close outside a specific Skyline "zone" to confirm that a new trend has begun.
By observing the relationship between the price and the dynamic wavy channel, traders can also gauge the strength of a move. If the price is riding the edge of the channel while breaking through horizontal levels, it suggests a very strong intraday trend that should not be shorted.
Conclusion
The BZ Tl Skyline Indicator is a robust all-in-one solution for traders who need to see both the trend and the key structural levels of the market. Its unique combination of volatility bands and stepped horizontal levels removes the guesswork from technical analysis, providing a clear and objective framework for navigating the markets with confidence.
4 Downloads
Last Update:
May 14, 2026 01:36 AM
Published:
Jan 22, 2026 19:16 PM
Category: