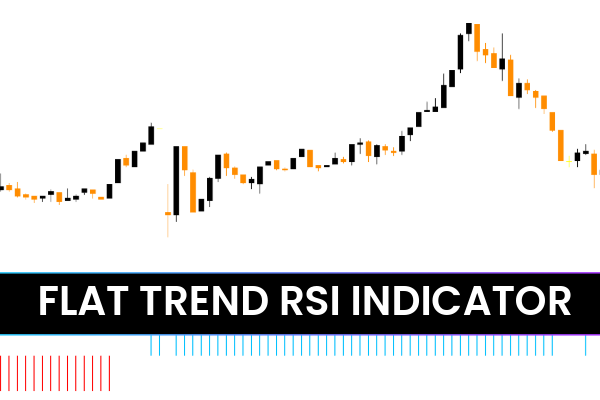
The Flat Trend RSI Indicator for MT4 is a momentum-based trading tool designed to help forex traders identify Trend Strength and potential trend reversals.
Based on the classic Relative Strength Index (RSI), this indicator goes beyond traditional RSI readings by providing color-coded trend visualization directly in the indicator window, making it easier to detect when a market is about to shift direction.
Whether you’re a beginner or an experienced trader, the Flat Trend RSI can help you spot market phases, confirm signals, and time your BUY/SELL entries with confidence.
👉 Download the Flat Trend RSI Indicator for MT4 free from IndicatorForest.com and add precision to your trading decisions.
How the Flat Trend RSI Indicator Works
The Flat Trend RSI Indicator is derived from the Relative Strength Index, a popular momentum oscillator that measures the speed and strength of price movements between two extremes (0 to 100).
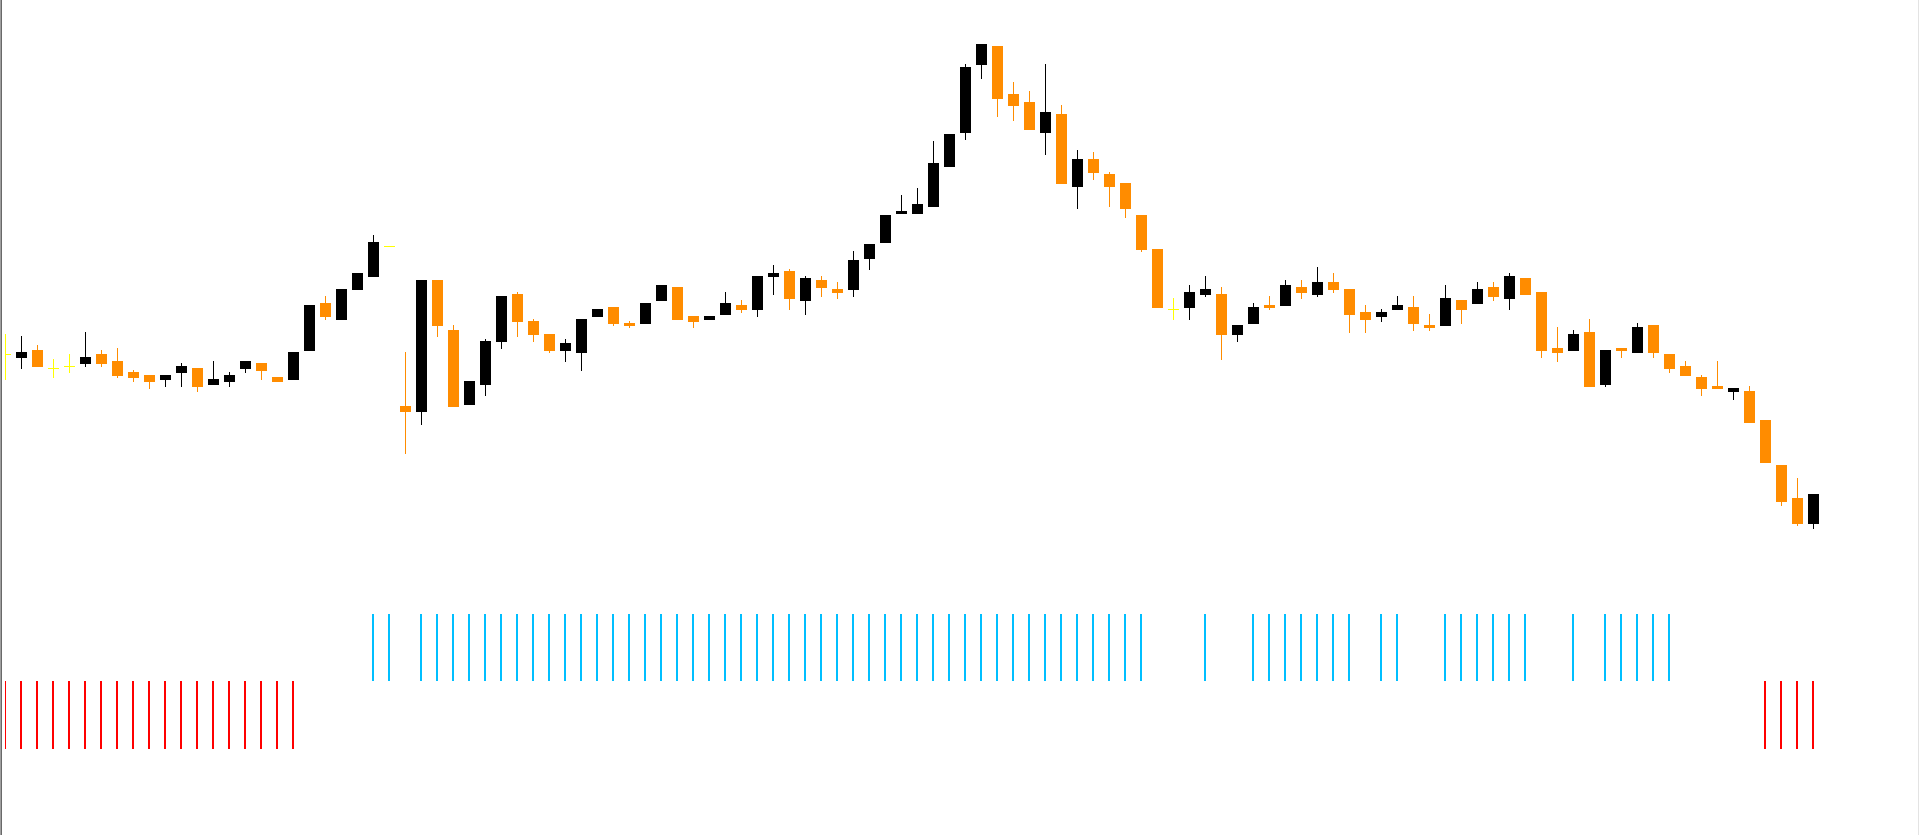
Unlike the standard RSI line, this version displays bar-style charts that change color according to the market’s momentum — making it much easier to interpret at a glance.
Blue Bars – Indicate bullish momentum or the start of an uptrend.
Red Bars – Indicate bearish momentum or the beginning of a downtrend.
These signals are based on RSI dynamics and price behavior, allowing the indicator to identify when the market is overbought, oversold, or about to reverse trend.
Flat Trend RSI BUY / SELL Signals
The indicator is displayed in a separate window below the main price chart. The color changes of the bars indicate clear buy or sell opportunities:
BUY Signal (Go Long)
When the bars switch from red to blue, it signals a transition to bullish momentum.
This means the market is likely exiting an oversold phase and entering an uptrend.
SELL Signal (Go Short)
When the bars switch from blue to red, it signals bearish momentum.
This indicates the market is likely leaving an overbought condition and starting a downtrend.
Pro Tip: Combine Flat Trend RSI with other tools like the Moving Average Crossover Indicator or MACD to confirm trend reversals before executing a trade.
Best Settings and Usage Tips
Recommended Timeframes: H1, H4, and Daily
Best Currency Pairs: EUR/USD, GBP/USD, USD/JPY
Trading Style: Swing or Intraday Trading
For higher accuracy:
Trade in the direction of the main trend.
Avoid entries during low-volatility periods (such as pre-Asian session).
Confirm the signal with candlestick patterns or a support/resistance breakout.
Advantages of the Flat Trend RSI Indicator
Easy to interpret color-based signals
Works across multiple timeframes
Ideal for beginners and professionals
Helps detect early reversals before major price swings
Can be used with any trading system or strategy
Conclusion
The Flat Trend RSI Indicator for MT4 is a reliable and straightforward trading tool that helps traders quickly identify market momentum and trend reversals. By using a color-coded RSI display, it eliminates the guesswork of interpreting traditional RSI levels.
Whether used alone or in combination with other indicators, this tool provides traders with clear BUY and SELL signals to enhance their accuracy and confidence in the forex market.
✅ Download the Flat Trend RSI Indicator for MT4 free today from IndicatorForest.com and start improving your trend detection strategy!
FAQ
Published:
Nov 11, 2025 00:32 AM
Category: