Master Dynamic Dynamic Support and Resistance with the Fibo Moving Average Indicator
In the highly competitive Forex markets, trading strictly off static horizontal lines often leaves day traders and swing traders vulnerable to market noise. Price Action is fluid, and institutional order flow constantly shifts based on underlying market velocity. To track these changes accurately, professional technical analysis relies on dynamic trend boundaries. The Fibo Moving Average indicator provides an advanced solution by synthesizing moving average smoothing parameters with core mathematical Fibonacci sequences.
By creating a dynamic channel that expands and contracts alongside real-time volatility, this powerful tool allows traders to spot low-risk pullbacks and major trend reversals with complete objectivity.
The Architecture of the Fibonacci Channel Matrix
Standard moving averages are notorious for lagging during fast-moving trend cycles or providing late entries during explosive market expansions. The Fibo Moving Average indicator addresses this limitation by overlaying a sequence of mathematically distinct envelopes over your primary price charts.
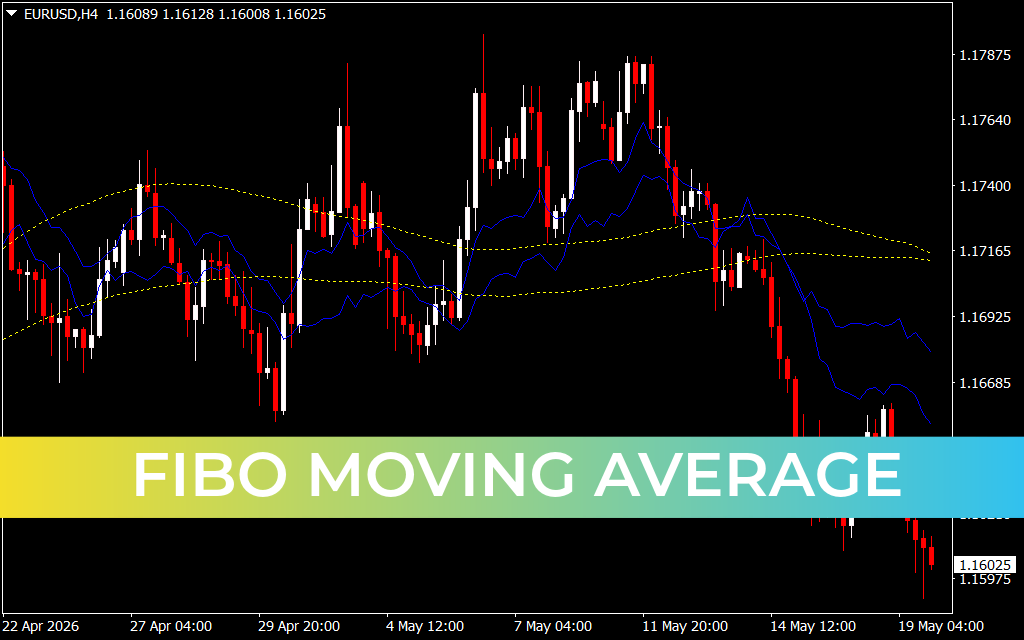
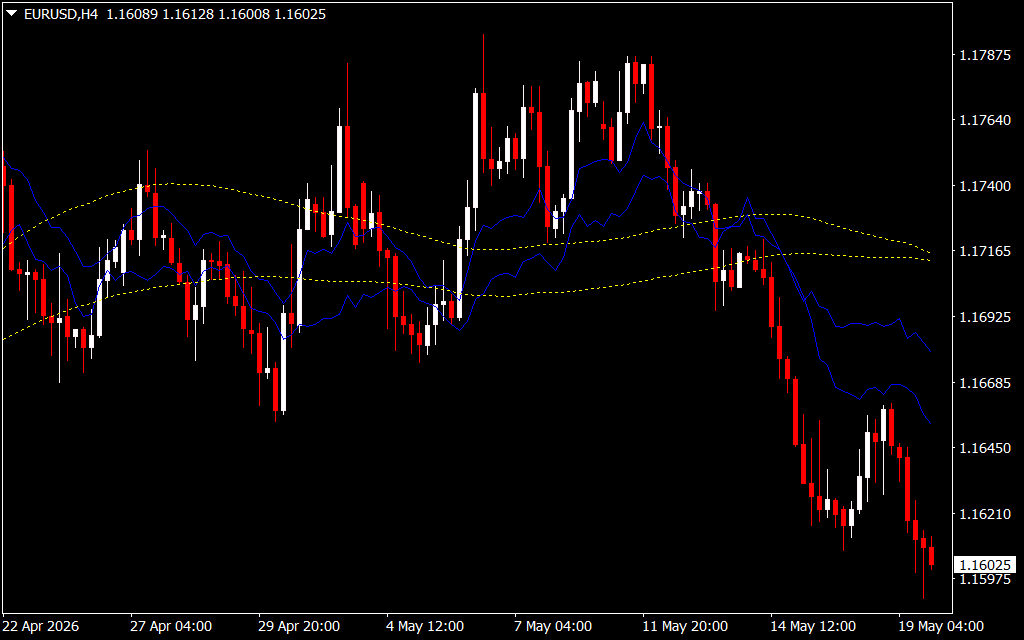
As observed on the 4-hour ($H4$) EUR/USD workspace, the indicator tracks macro market structure by implementing a multi-layered design template:
- The Core Sentiment Baseline: Running through the center of the dynamic channel are yellow dashed moving average lines. This central matrix acts as the ultimate multi-timeframe trend filter, establishing a clear bullish structural bias when price remains above, and a bearish bias when price drops below.
- Fibonacci Expansion Bands: Branching outward from the core baseline are solid blue dynamic boundary bands. These envelopes are mapped using fixed Fibonacci multipliers (such as the classic 23.6%, 38.2%, and 61.8% ratios). These outer lines establish flexible Support And Resistance boundaries that adjust automatically as market volatility spikes.
Implementing Rule-Based Execution Strategies
Integrating the dynamic layers of the Fibo Moving Average utility into your MetaTrader platform establishes a highly mechanical framework for navigating trend cycles.
1. Trading Dynamic Retracements (Trend Continuation)
During a strong, institutional downward expansion—as demonstrated by the long series of red candles on the $H4$ interval—the market will periodically experience minor counter-trend pullbacks. With the Fibo Moving Average active, you can monitor these retracements as they retest the inner blue bands or the central yellow baseline. When price action rejects these dynamic zones via bearish engulfing signatures, it provides a low-risk entry to rejoin the dominant trend.
2. Spotting Volatility Band Exhaustion
The outermost blue lines calculated by the indicator represent extreme mathematical standard extensions for a given cycle. When price action spikes vertically into these outer boundaries during low-volume sessions, it highlights an overextended market condition. Technical analysts can utilize this metric to anticipate local profit-taking phases and manage stop-loss placements safely outside the dynamic channel structure.
Conclusion
The Fibo Moving Average indicator is a robust charting assistant tailored for traders who value rule-based clarity. By replacing traditional manual line drawing with mathematical geometric bands, it removes emotional bias from your execution loop. Download the Fibo Moving Average indicator today to streamline your technical analysis workspace and dominate multi-timeframe trends.
2 Downloads
Last Update:
May 20, 2026 02:00 AM
Published:
Jan 19, 2026 10:53 AM
Category: