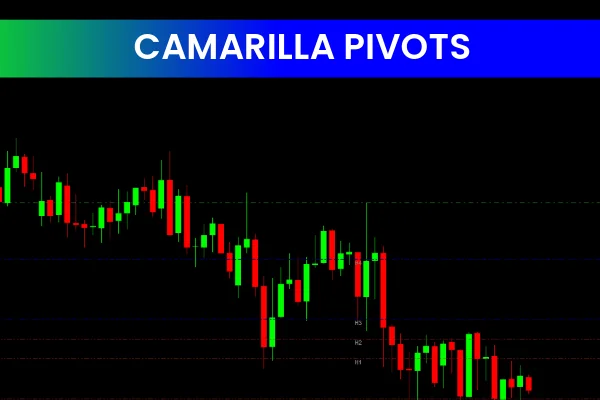
]The Camarilla Pivots Indicator is a popular and free Forex tool that helps traders identify potential support and resistance levels in the market. Available for the MetaTrader 4 (MT4) platform, this indicator is straightforward to install and beginner-friendly.
It is based on the Camarilla Equation, developed by Nick Stott in 1989, which calculates levels using the previous day’s high, low, and close prices. These levels help traders determine entry and exit points while factoring in market volatility.
How the Camarilla Pivots Indicator Works
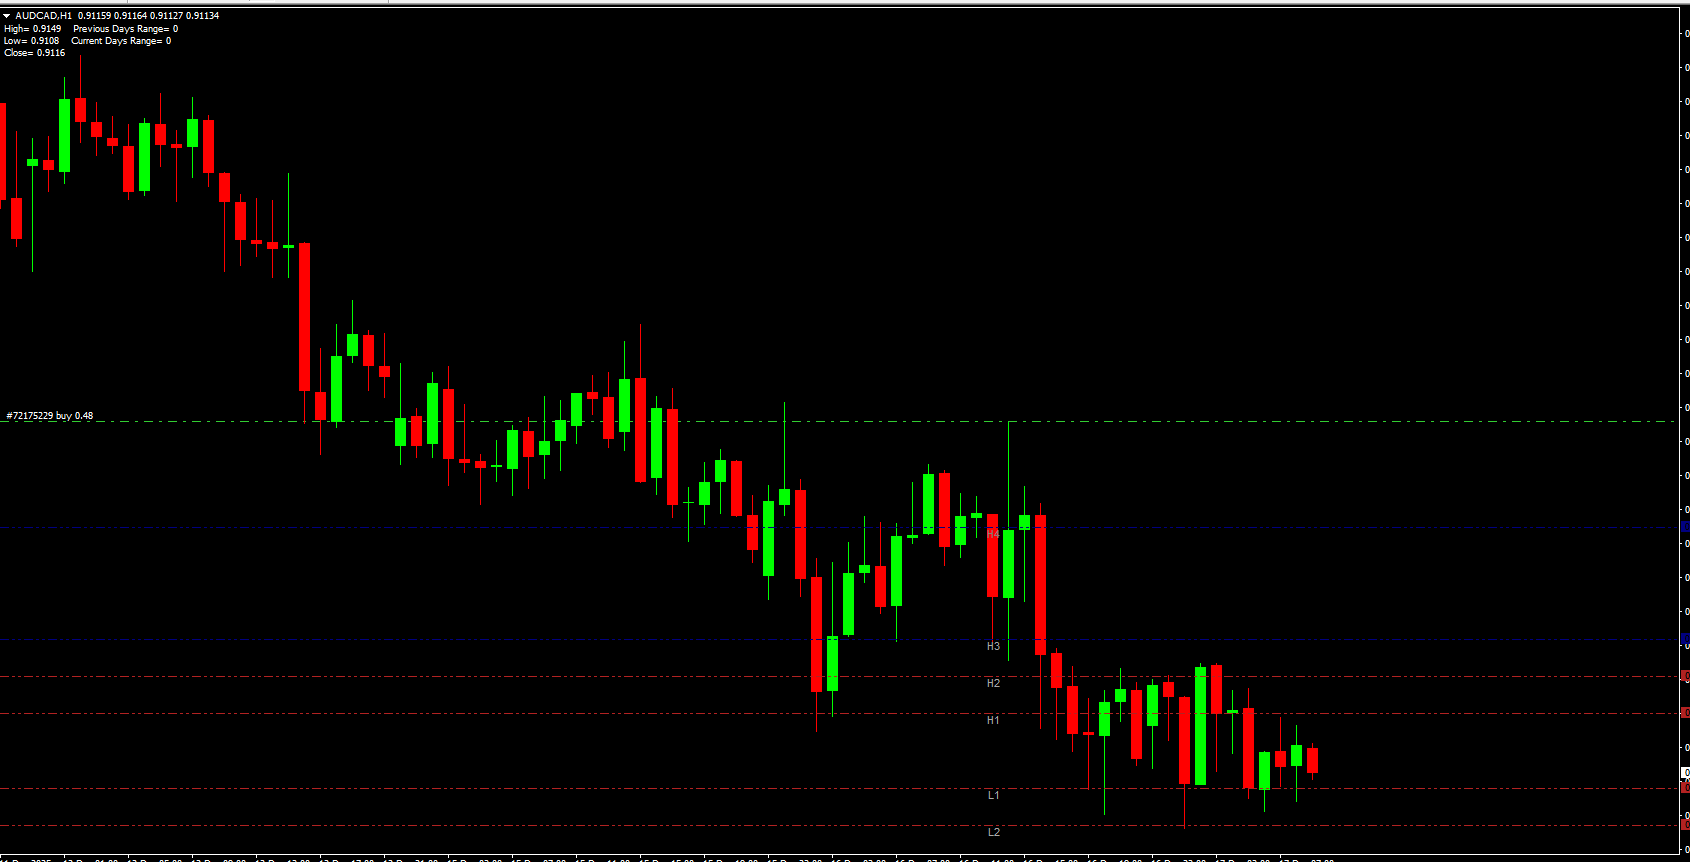
The indicator calculates eight key levels of Support And Resistance for the current trading session:
Resistance Levels: R1, R2, R3, R4
Support Levels: S1, S2, S3, S4
These levels are derived from the volatility of the previous day’s Price Action and are used by traders to:
Identify potential breakout or reversal zones
Set entry points for trades
Place stop-loss and take-profit levels
Gauge market sentiment based on price reactions at these levels
Features of the Camarilla Pivots Indicator
Accurate Support and Resistance Levels: Plots key pivot points to guide trading decisions.
Based on Camarilla Equation: Utilizes previous day’s high, low, and close for reliable calculations.
Easy to Use: Beginner-friendly and requires minimal setup.
Visual Clarity: Levels are plotted clearly on MT4 charts for quick reference.
Supports All Currency Pairs: Works across any Forex pair on MT4.
Benefits of Using the Camarilla Pivots Indicator
Identifies High-Probability Zones: Helps traders spot potential reversal or breakout areas.
Improves Risk Management: Traders can set precise stop-loss and take-profit levels.
Saves Time: Automatically calculates signal levels, eliminating manual pivot calculations.
Versatile Trading Applications: Suitable for day trading, Scalping, and swing trading strategies.
Enhances Trading Confidence: Provides clear reference points for market entries and exits.
How to Trade with Camarilla Pivots
Trend Reversal Trades: Look for price rejection at S3/S4 for bullish signals or R3/R4 for bearish signals.
Breakout Strategies: Enter trades when price breaks through key resistance or support levels.
Setting Targets: Use pivot levels as potential take-profit zones and place stop-loss beyond the nearest pivot.
Combine with Other Indicators: Enhance accuracy using trend indicators, candlestick patterns, or oscillators.
Final Thoughts
The Camarilla Pivots MT4 Indicator is a powerful tool for Forex traders seeking accurate support and resistance levels. By leveraging previous day price action and volatility, traders can make more informed decisions, set precise entries/exits, and improve overall trading performance.
FAQ
Camarilla Pivots calculates key support and resistance levels based on the previous day high, low, and close. These pivot levels help identify potential price reaction zones for the current trading day.
Use R3 and R4 as resistance levels, use S3 and S4 as support levels, trade bounces off pivot levels, trade breakouts when price moves beyond R4 or S4, and use pivots for intraday trading strategies.
Key levels include R4 (strong resistance), R3 (resistance), R2 and R1 (weaker resistance), central pivot point, S1 and S2 (weaker support), S3 (support), and S4 (strong support).
Camarilla Pivots work best on intraday timeframes (M15, M30, H1) where daily pivot levels are most relevant. They are recalculated daily based on the previous day price action.
Combine with trend indicators for direction, use with momentum oscillators for confirmation, integrate with price action patterns, and combine with volume analysis to validate pivot reactions.
Published:
Dec 17, 2025 03:11 AM
Category: