Candle Patterns Indicator

Candle Patterns Indicator
Free

The Candlestick Pattern Indicator is a favorite tool among Price Action traders. Candlestick patterns, categorized as bullish or bearish, help traders identify potential trend reversals or continuations. Popular patterns include Doji, Pin Bar, Evening Star, Hammer, Morning Star, Shooting Star, Engulfing Pattern, Harami, and Piercing Line.

While experienced traders can recognize patterns visually, scanning the chart manually is time-consuming. The Candlestick Pattern Indicator for MT4 simplifies this process by automatically detecting candlestick patterns, displaying alert notifications, and marking them with arrows on the chart.

How the Candlestick Pattern Indicator Works

Using the indicator is straightforward:

Mount the indicator on your MT4 chart.

Choose the candlestick patterns you want to track.

Adjust notification settings for alerts.

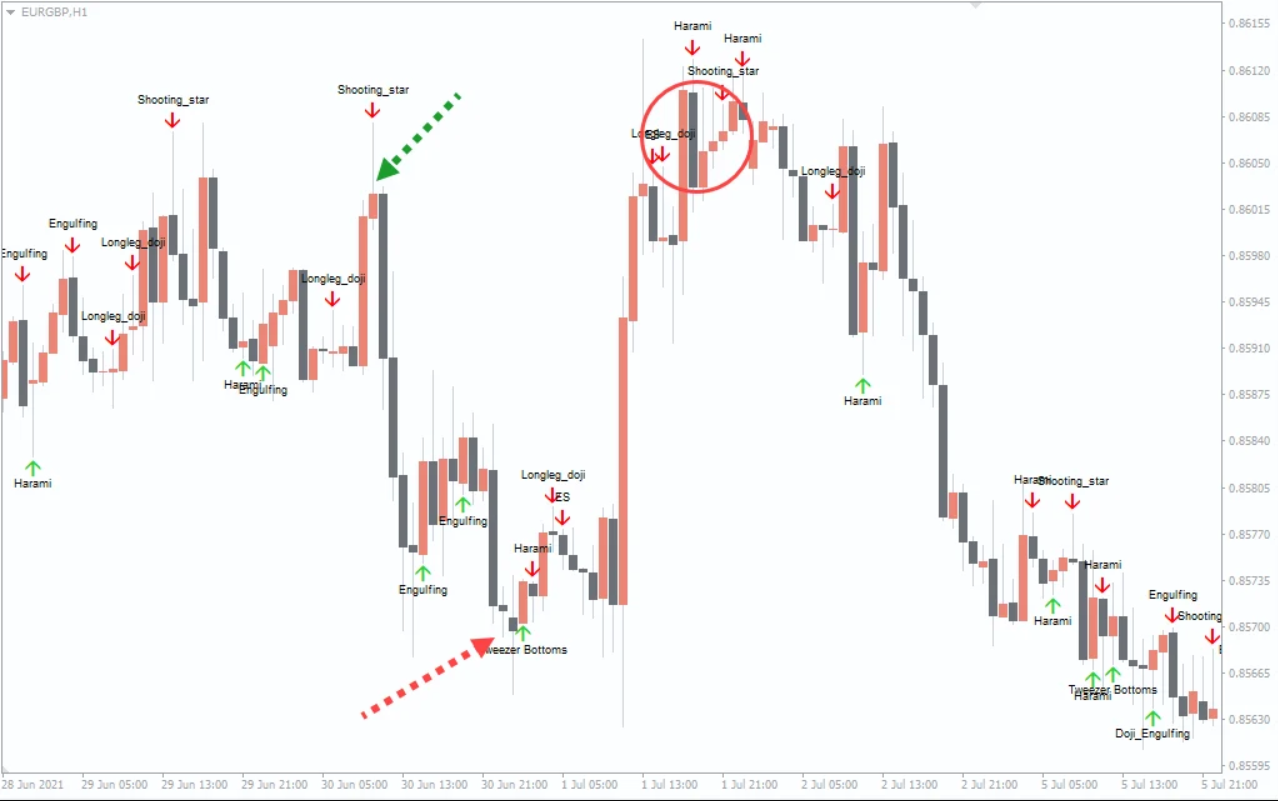
Once configured, the indicator scans the chart for patterns. A bearish candle pattern is marked with an arrow above the candlestick, while a bullish pattern shows an arrow below. This visual aid allows traders to focus on actionable trading opportunities without guessing the candlestick type.

Benefits of Using the Candlestick Pattern Indicator

Automatically detects popular candlestick patterns

Displays alerts and arrows for easy recognition

Helps establish entry, exit, and trailing stop signals

Works on all timeframes and currency pairs

Enhances trading decisions without manual scanning

Trading with the Candlestick Pattern Indicator

Not every candlestick qualifies as a trade signal. Traders should follow these principles:

Trade bullish candle patterns only in uptrends

Trade bearish candle patterns only in downtrends

Consider patterns that appear at Support And Resistance zones

Example: On an EUR/GBP one-hour chart, the indicator identifies a Shooting Star at a resistance level, signaling a potential reversal. Subsequently, the price falls. A Doji pattern forms at a support zone, followed by a price rise. Similarly, a Hammer at resistance signals another potential reversal, confirmed by subsequent price movement.

By combining these signals with market context, traders can improve trade accuracy and minimize risks.

Conclusion

Candlestick patterns are a powerful tool for technical analysts who rely on price action strategies. The Candlestick Pattern Indicator for MT4 automates the identification process, highlights patterns with arrows, and sends alerts to enhance trading decisions. This indicator is an essential addition to any forex trader’s toolkit, making it easier to spot reversals, plan entries, and execute trades efficiently.

FAQ

A favorite tool among price action traders for MT4 with candlestick patterns categorized as bullish or bearish helping traders identify potential trend reversals or continuations including popular patterns such as Doji Pin Bar Evening Star Hammer Morning Star Shooting Star Engulfing Pattern Harami and Piercing Line automatically detecting candlestick patterns displaying alert notifications and marking them with arrows on chart.

Using indicator is straightforward: mount indicator on MT4 chart, choose candlestick patterns you want to track, and adjust notification settings for alerts. Once configured, indicator scans chart for patterns. Bearish candle pattern is marked with arrow above candlestick while bullish pattern shows arrow below. This visual aid allows traders to focus on actionable trading opportunities without guessing candlestick type. While experienced traders can recognize patterns visually, scanning chart manually is time-consuming but indicator simplifies this process.

Not every candlestick qualifies as trade signal. Traders should follow these principles: trade bullish candle patterns only in uptrends, trade bearish candle patterns only in downtrends, and consider patterns that appear at support and resistance zones. Example: on EUR/GBP one-hour chart, indicator identifies Shooting Star at resistance level signaling potential reversal with price subsequently falling. Doji pattern forms at support zone followed by price rise. Similarly, Hammer at resistance signals another potential reversal confirmed by subsequent price movement. By combining signals with market context, traders can improve trade accuracy and minimize risks.

It automatically detects popular candlestick patterns, displays alerts and arrows for easy recognition, helps establish entry exit and trailing stop signals, works on all timeframes and currency pairs, and enhances trading decisions without manual scanning. Indicator simplifies process by automatically detecting candlestick patterns removing need for manual scanning and making it easier for traders to identify actionable trading opportunities.

Indicator automatically detects popular candlestick patterns including Doji Pin Bar Evening Star Hammer Morning Star Shooting Star Engulfing Pattern Harami and Piercing Line. These patterns are categorized as bullish or bearish helping traders identify potential trend reversals or continuations. A bearish candle pattern is marked with arrow above candlestick while bullish pattern shows arrow below. By automatically detecting these patterns and displaying alert notifications, indicator simplifies process of pattern recognition that would otherwise require manual scanning making it valuable for price action traders.
5 Downloads

Published:

Dec 02, 2025 02:34 AM

Category:

We use cookies to personalize your experience. By continuing to visit this website you agree to our use of cookies

GDPR and cookie policy