iding Institutional Momentum: A Comprehensive Guide to the CCI Trends Indicator
In the fast-moving foreign exchange market, capturing the exact moment a market transitions from a quiet consolidation phase into an aggressive trend expansion is the key to consistent profitability. While traditional lagging indicators like standard moving averages often get retail day traders into a move far too late, cyclical oscillators are engineered to measure velocity. The CCI Trends Indicator for MT4/MT5 elevates Donald Lambert’s classic Commodity Channel Index formula, combining structural smoothing with clear visual filters to help high-frequency scalpers and intraday operators stay perfectly aligned with institutional order flow.
Decoding the Volatility Matrix on the EUR/USD M5 Chart
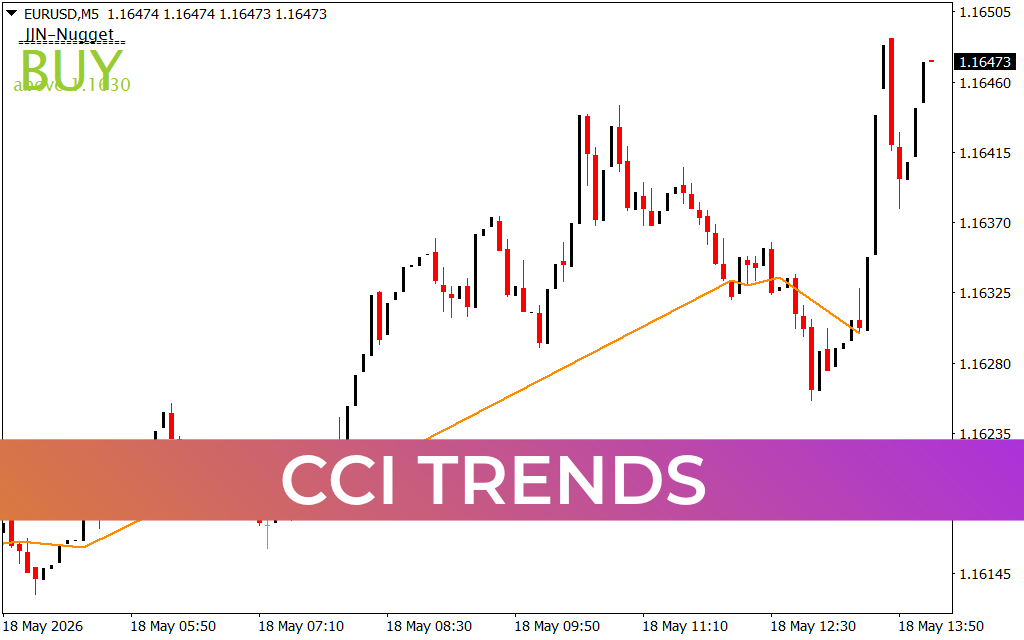
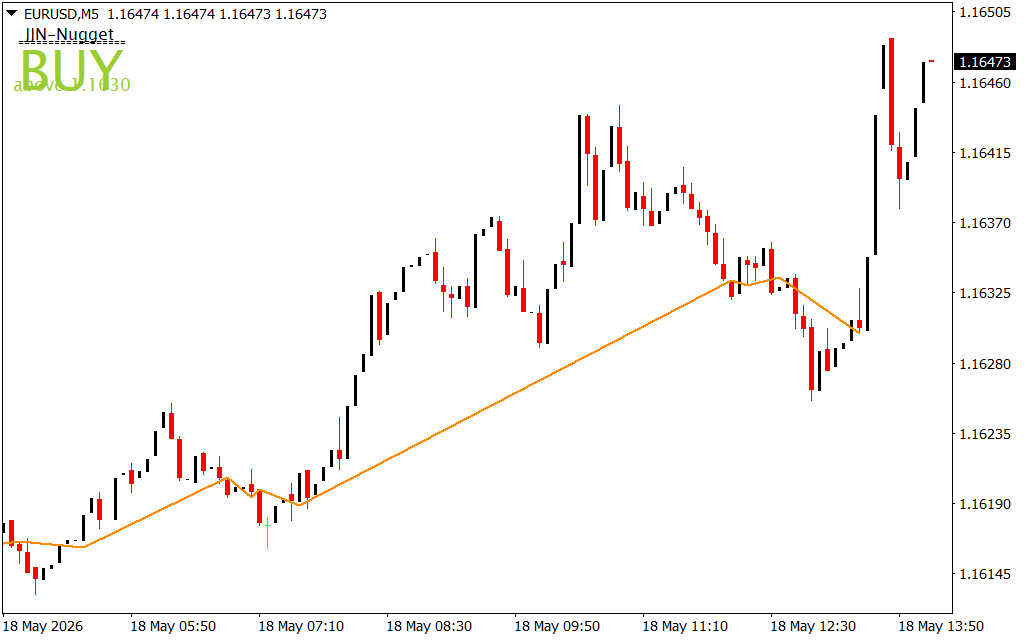
The attached EUR/USD 5-minute (M5) chart beautifully highlights how the CCI Trends engine clarifies Price Action during a shifting intraday trading session. Located in the indicator sub-window directly beneath the price field, the tool translates complex multi-period statistical variance into a pristine, dual-color histogram that oscillates around a critical $0.00$ baseline.
During the early morning session of May 18, the currency pair compressed within a tight consolidation squeeze, establishing a localized accumulation floor near 1.16135. In a typical charting setup, standard oscillators fluctuate constantly back and forth inside neutral territory, tricking retail accounts into premature counter-trend positions.
Notice how the CCI Trends indicator manages this compression zone: the histogram bars remain exceptionally shallow and tightly bound to the zero baseline, signaling a complete absence of directional market velocity. The definitive, tradeable breakout materializes near the 07:40 session marker. As buyers inject substantial volume into the market, the price clears the 1.16195 structural ceiling, and the histogram bars surge decisively above the $0.00$ threshold, shifting into a vivid, uniform blue matrix.
Spotting Trend Exhaustion and Executing Reversals
The true strategic edge of the CCI Trends indicator lies in its ability to pinpoint overextended volatility thresholds well before a trend rotation becomes visible on the price candlesticks. Following the initial morning expansion, the pair embarked on a massive markup wave that peaked aggressively near the 1.16435 local swing high.
As the upward momentum reached extreme statistical limits, the blue histogram bars formed a prominent structural dome in the sub-window, warning day traders that buying pressure was actively exhausting. The Market Structure shifted rapidly into an institutional distribution phase between the 08:50 and 10:10 markers.
True to its formula, the CCI Trends engine caught this trend rotation ahead of the crowd. The histogram bars collapsed back through the zero baseline and flipped into a solid red profile, providing an objective, rules-based sell signal. Currently trading near 1.16297, the persistent red bars show that bears maintain total control of the immediate order flow. By replacing subjective trendlines with a clean mathematical momentum filter, the CCI Trends indicator gives you the precision required to optimize execution speed, protect your capital during low-volatility squeezes, and capture massive structural waves with absolute confidence.
1 Download
Last Update:
May 18, 2026 17:11 PM
Published:
Jan 19, 2026 21:09 PM
Category: