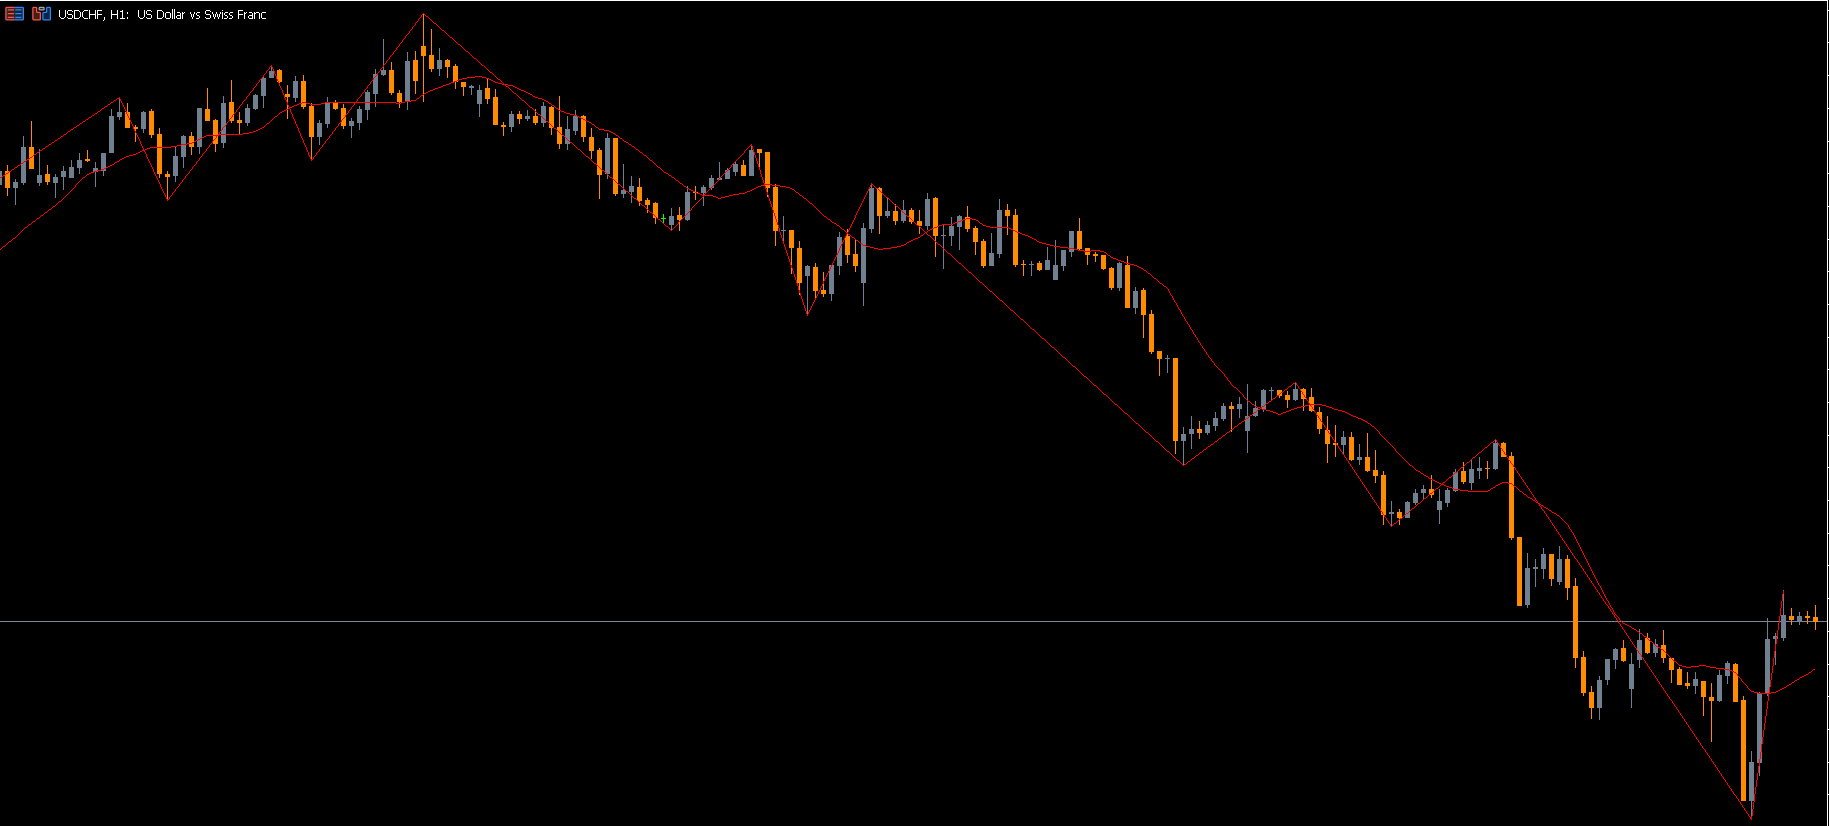
The indicator uses the ZigZag algorithm to identify key swing highs and lows. Then, it automatically draws an equidistant channel that connects these points.
The upper and lower lines act as dynamic Support And Resistance levels.
The middle line (often dotted) shows the median price level, helping traders anticipate retracements and continuation moves.
The channel width adjusts according to market volatility, making it suitable for both trending and ranging markets.
Key Features and Benefits
Automatic Channel Drawing: No manual plotting needed – the indicator instantly identifies trend channels.
Clear Support and Resistance: The outer channel lines provide accurate trading zones for entries and exits.
Excellent Risk/Reward Ratio: Since stop losses are placed just beyond channel lines, the risk is minimal compared to potential profit.
Adapts to Any Market: Works on all currency pairs, timeframes, and even indices or commodities.
Perfect for All Traders: From beginners to professionals, it simplifies price structure analysis and trading decisions.
How to Trade with the Channel ZigZag Indicator for MT5
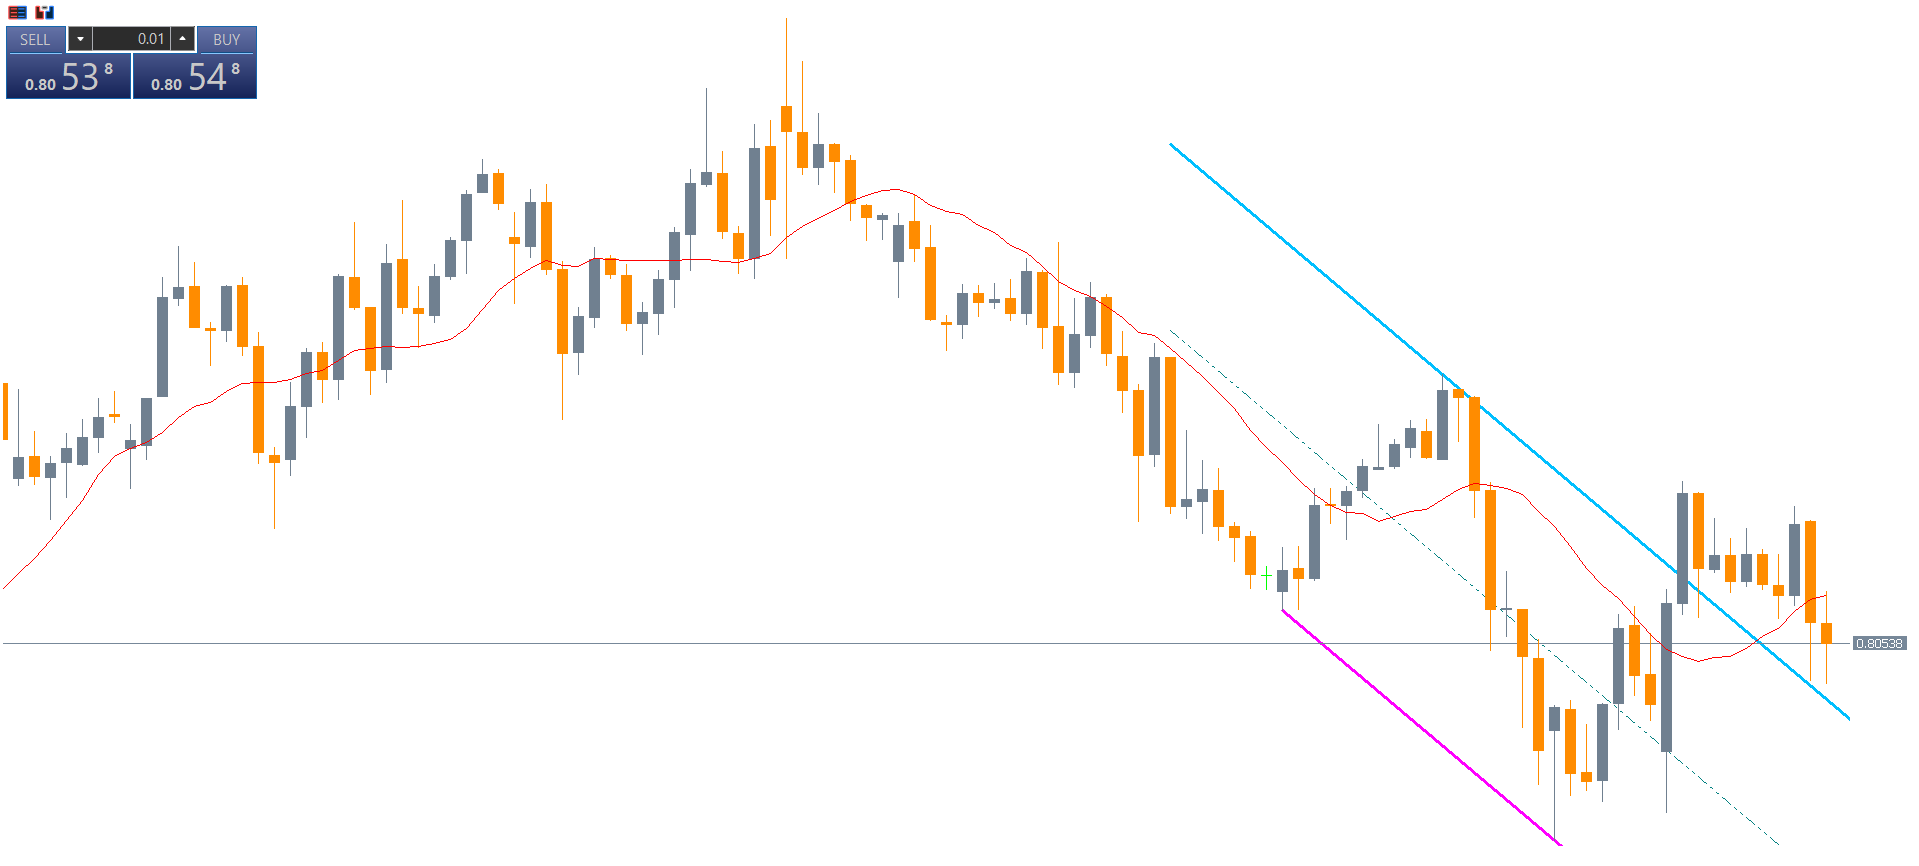
The EUR/USD H4 chart example (see below) illustrates how the Channel ZigZag Indicator works in live market conditions. The indicator displays blue and pink outer lines and a dotted median line.
BUY (Bullish) Signal
When the channel is ascending, it indicates a bullish market.
Look for price touches at the lower channel (support).
Confirm with a bullish reversal candle (like a pin bar or bullish engulfing).
Enter a BUY position at the lower line.
Place stop loss just below the previous swing low.
Set take profit near the upper resistance line.
SELL (Bearish) Signal
When the channel is descending, it indicates a bearish trend.
Watch for price touches at the upper channel (resistance).
Confirm with a bearish reversal candlestick.
Enter a SELL position near the upper line.
Place stop loss above the previous swing high.
Set take profit at the lower channel or next support level.
These setups provide a high risk-to-reward ratio because the stop loss distance is small relative to the target potential.
Tips for Best Results
Combine the Channel ZigZag Indicator with Price Action or Trend Confirmation tools such as the Moving Average or RSI.
Use higher timeframes (H1, H4, D1) for stronger signals and clearer trend channels.
Confirm entries with Candlestick Patterns to reduce false signals.
Conclusion
The Channel ZigZag Indicator for MT5 is an indispensable tool for technical Forex traders. It not only defines BULLISH and BEARISH market structures but also automatically identifies support and resistance levels that can be used as profit targets.
This indicator offers simplicity, accuracy, and consistency—qualities every trader needs. Whether you’re Scalping or swing trading, the Channel ZigZag Indicator delivers precise market structure visualization for better decision-making.
📈 Download the Channel ZigZag Indicator for free at IndicatorForest.com and take your technical trading strategy to the next level!
FAQ
3 Downloads
Published:
Nov 10, 2025 03:33 AM
Category: