Mastering Market Momentum: The Power of Slope Direction Lines
In the fast-paced world of technical analysis, traders are constantly searching for ways to distinguish between a healthy trend and market noise. While standard moving averages are a staple on many charts, they often suffer from significant lag or produce "whipsaw" signals during periods of consolidation. The Slope Direction Line indicator for MetaTrader 4 is a sophisticated evolution of the classic moving average, designed to give traders an immediate, color-coded visual of price momentum and trend health.
What is the Slope Direction Line?
The Slope Direction Line is a trend-following indicator that calculates the average price over a specific period, much like a moving average. However, its primary advantage lies in its mathematical sensitivity to the angle of change. Unlike a static line that only tells you the average price, this indicator focuses on the slope of the curve.
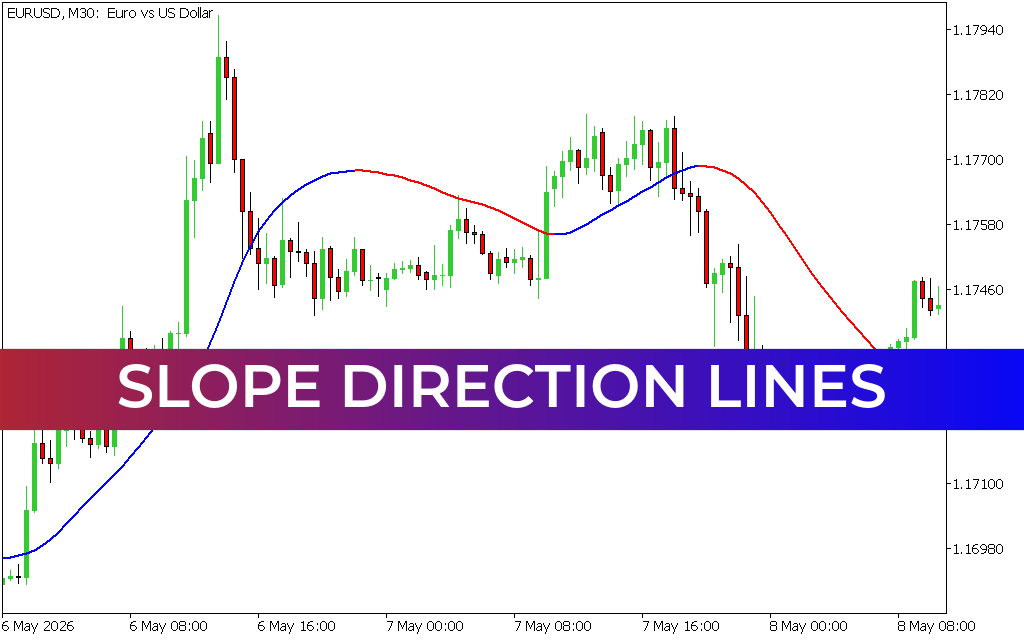
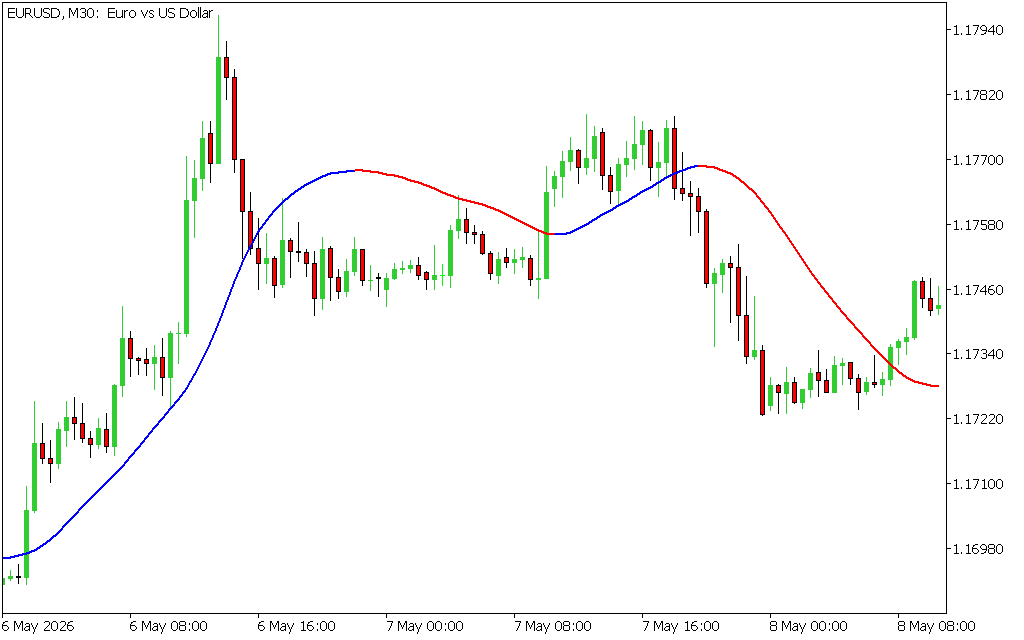
As seen on the EUR/USD M30 chart, the indicator changes color dynamically based on its trajectory:
- Blue Line: Indicates a positive slope, signaling that upward momentum is increasing and the prevailing trend is bullish.
- Red Line: Indicates a negative slope, signaling that downward momentum is gaining traction and the trend is bearish.
By using color to represent the derivative of price movement, the indicator allows for "at-a-glance" decision-making, reducing the cognitive load on the trader.
Eliminating Lag with Advanced Smoothing
One of the biggest hurdles for trend followers is entering a trade too late. Traditional averages often turn only after a significant portion of the move has already occurred. The Slope Direction Line utilizes advanced smoothing algorithms—often based on Hull Moving Average (HMA) or Linear Regression logic—to stay as close to the current Price Action as possible without becoming overly reactive to minor fluctuations.
This balance between smoothness and responsiveness makes it an ideal tool for filtering out "market noise." When the line is flat or frequently changing color, it serves as a vital warning that the market is in a range-bound state, prompting disciplined traders to stay on the sidelines.
Strategic Applications for Modern Traders
The versatility of the Slope Direction Line makes it a perfect fit for various trading systems:
- Trend Confirmation: Use the Slope Direction Line on a higher timeframe (like H4 or Daily) to determine the "anchor" trend. Only take trades on lower timeframes that align with the color of the higher-period line.
- Precise Entry Points: For scalpers, a color change on the M1 or M5 chart can act as a trigger. A shift from red to blue combined with a price bounce off a support level offers a high-probability entry with a clearly defined stop-loss.
- Dynamic Trailing Stops: The line itself acts as a moving level of support or resistance. Traders can "trail" their stop-losses just behind the line, staying in a winning trade as long as the color remains consistent and exiting the moment the slope begins to flatten or flip.
For any trader looking to simplify their technical analysis while maintaining high levels of accuracy, the Slope Direction Line is an essential upgrade. It transforms a simple line into a powerful story of market sentiment, helping you stay on the right side of the trend with confidence.s.
7 Downloads
Last Update:
May 12, 2026 03:27 AM
Published:
Jan 24, 2026 12:49 PM
Category: