The Coeffoline Hist Indicator is a powerful and easy-to-use technical analysis tool designed for Forex traders using the MT4 trading platform. This free indicator is widely appreciated for its ability to identify trend direction, trend strength, and key Support And Resistance levels. By combining a histogram and a signal line, the Coeffoline Hist Indicator helps traders make clearer and more confident trading decisions.
Whether you are a beginner learning technical analysis or an experienced trader refining your strategy, the Coeffoline Hist Indicator can play a valuable role in improving trade timing and market understanding.
Understanding how the Coeffoline Hist Indicator works
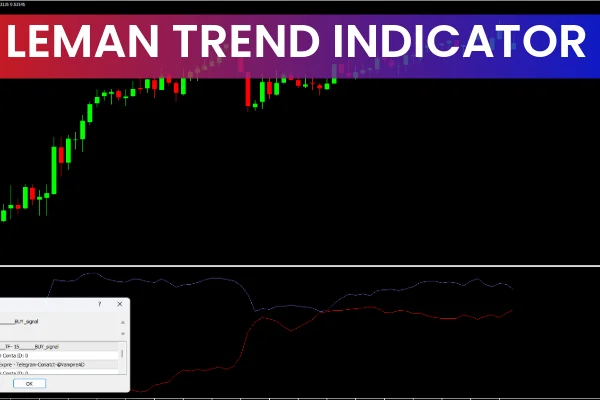
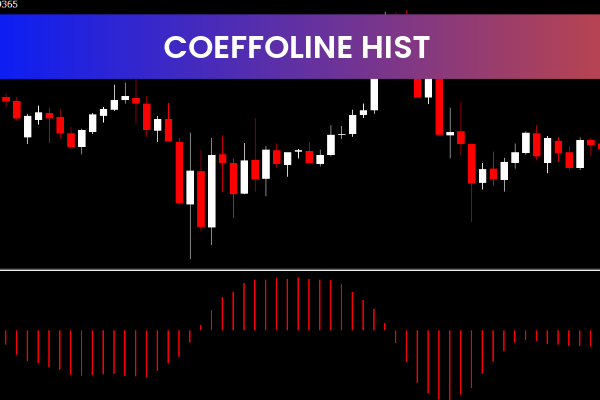
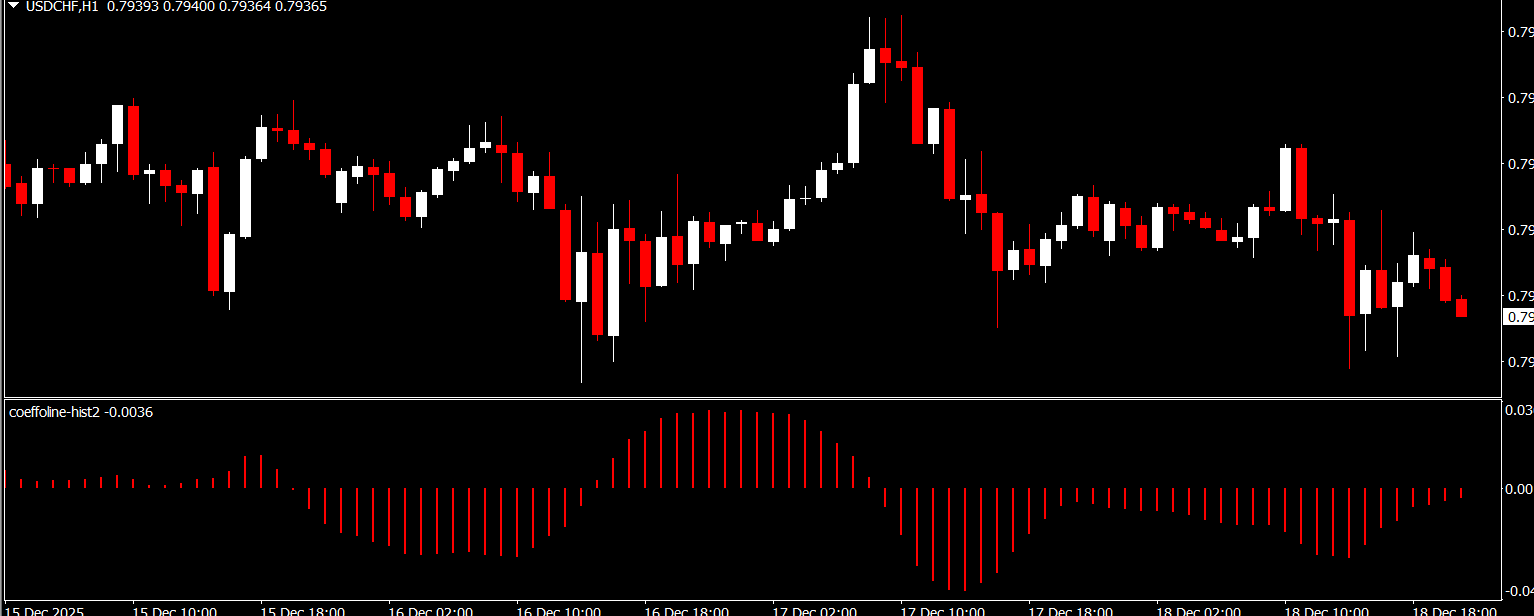
The Coeffoline Hist Indicator plots two visual elements directly on the price chart. The first is a histogram that measures the difference between two internal calculation lines. The second is a smooth line that shows overall trend direction.
The histogram reflects market momentum. When histogram bars grow larger, it signals increasing trend strength. When bars shrink or change direction, it often indicates weakening momentum or a potential Trend Reversal. The signal line, on the other hand, provides traders with a clearer view of whether the market is trending upward or downward.
How the Coeffoline Hist Indicator identifies trends
Trend identification is one of the primary strengths of the Coeffoline Hist Indicator. When the signal line moves upward and the histogram remains positive, it confirms a bullish trend. Conversely, a downward-sloping line with negative histogram values confirms a bearish trend.
This visual simplicity allows traders to avoid overcomplicated indicators and focus on the dominant market direction. The indicator works well on multiple timeframes, making it suitable for Scalping, day trading, and swing trading strategies.
Using the Coeffoline Hist Indicator for support and resistance
Another key benefit of the Coeffoline Hist Indicator is its ability to help traders recognize support and resistance levels. When price repeatedly reacts near the same histogram levels or when momentum stalls near key zones, these areas often act as hidden support or resistance.
By combining the indicator with basic Price Action analysis, traders can better anticipate potential bounces or breakouts. This makes the Coeffoline Hist Indicator a valuable companion to horizontal support and resistance drawing.
Identifying overbought and oversold market conditions
The Coeffoline Hist Indicator can also assist in spotting overbought and oversold conditions. When the histogram reaches extreme values and begins to contract, it may signal that the current trend is losing strength. These conditions often appear before price corrections or reversals.
Traders can use this information to tighten stop losses, secure profits, or prepare for countertrend trades when combined with confirmation from other indicators or candlestick patterns.
Entry and exit strategies using the Coeffoline Hist Indicator
One common entry strategy is to trade in the direction of the signal line once the histogram confirms momentum. For example, entering buy trades when the histogram turns positive and the line slopes upward can improve trade accuracy.
Exit points can be identified when the histogram weakens or crosses the zero level against the trade direction. This helps traders exit positions before major reversals occur and manage risk more effectively.
Why the Coeffoline Hist Indicator is ideal for all traders
The Coeffoline Hist Indicator is especially useful because of its simplicity. It does not overwhelm traders with excessive signals and works well in trending Forex markets. Both novice and experienced traders can benefit from its clear visual structure and reliable signals.
Because it is a free MT4 indicator, it is accessible to traders worldwide. When used correctly, it can become a core component of a consistent Forex trading strategy.
To explore more high-quality Forex indicators and trading tools, visit IndicatorForest.com and enhance your trading performance today.
FAQ
2 Downloads
Published:
Dec 18, 2025 15:08 PM
Category: