The Moving Average Ribbon Indicator is a popular and free Forex tool available for MetaTrader 4 (MT4). It is designed to help traders identify market trends and key support and resistance levels by plotting multiple moving averages of different lengths on the same chart. This visual representation allows traders to understand market direction at a glance and make informed trading decisions.

By using the Moving Average Ribbon Indicator, traders can quickly determine whether the market is trending or consolidating, which is essential for timely entries and exits. Its flexibility and customization make it suitable for both beginners and experienced Forex traders.
How the Moving Average Ribbon Indicator Works
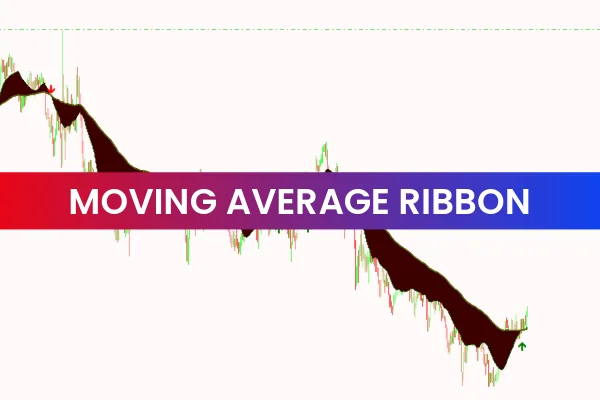
The Moving Average Ribbon Indicator works by plotting multiple moving averages of varying lengths on a single chart. The overlapping lines create a ribbon-like appearance, helping traders identify:
Trend direction: A ribbon moving upward indicates an uptrend, while a downward-moving ribbon indicates a downtrend
Support And Resistance levels: Convergence or divergence of the moving averages often marks key price levels
Market momentum: The spacing between the averages provides insight into trend strength and potential reversals
Traders can customize the lookback period and moving average type to suit their trading style and preferred timeframe, making the indicator highly adaptable for various strategies.
Key Features of the Moving Average Ribbon Indicator
The Moving Average Ribbon Indicator offers several features that make it a valuable MT4 tool:
Plots multiple moving averages of different lengths on the same chart
Identifies trend direction visually for easier trade analysis
Highlights support and resistance levels for improved trade planning
Customizable parameters for moving average type, length, and appearance
Works on all MT4 timeframes and currency pairs
Free and easy to install on MT4
Suitable for Scalping, day trading, swing trading, and long-term trend analysis
These features allow traders to analyze market trends and potential reversal points quickly and efficiently.
Benefits of Using the Moving Average Ribbon Indicator
The Moving Average Ribbon Indicator provides several benefits for Forex traders:
Helps visually identify strong trends and market direction
Highlights key support and resistance zones for better risk management
Allows traders to time entries and exits more accurately
Reduces guesswork by providing a clear visual representation of price movement
Suitable for traders of all experience levels and adaptable to different trading strategies
By incorporating this indicator into their trading setup, traders can enhance trend analysis, improve timing, and make more informed trading decisions.
How Traders Can Use the Moving Average Ribbon Indicator Effectively
To use the Moving Average Ribbon Indicator effectively:
Enter long positions when the ribbon shows a clear upward trend with moving averages aligned sequentially
Enter short positions when the ribbon shows a downward trend with moving averages aligned in reverse
Use converging ribbon lines as potential support or resistance levels for stop-loss and take-profit placements
Combine with other indicators such as oscillators, volume indicators, or trend lines for confirmation
Adjust moving average types and periods to match your preferred timeframe and trading style
This approach allows traders to maximize opportunities during trending markets while minimizing risk during consolidation periods.
Why the Moving Average Ribbon Indicator Is Popular
The Moving Average Ribbon Indicator is widely used because it simplifies trend and support/resistance analysis. By plotting multiple moving averages in a visually intuitive way, traders can quickly assess market direction and make well-informed trading decisions. Its customization options and adaptability to various strategies make it a favorite among MT4 users.
Overall, the Moving Average Ribbon Indicator is a valuable MT4 tool for Forex traders seeking to improve trend analysis, identify key price levels, and enhance trading performance.
Download the Moving Average Ribbon Indicator today from IndicatorForest.com and gain a powerful tool to analyze trends and support/resistance levels in Forex.
FAQ
Moving Average Ribbon plots several moving averages of different lengths on the same chart, forming a ribbon. The alignment and spacing of these lines reveal trend direction, strength and potential support or resistance zones.
When all averages are stacked in order and sloping upward, it signals a strong uptrend; the opposite alignment points to a strong downtrend. A tangled, flat ribbon indicates a ranging or indecisive market.
Traders often buy pullbacks toward the ribbon in an uptrend and sell rallies into it in a downtrend. When price and the ribbon flatten out or cross repeatedly, it can be a clue to reduce exposure or wait for a clearer trend.
Yes, you can change periods, types and colors to match your trading style and timeframe. Shorter periods highlight quicker changes, while longer periods emphasize broader trends.
Oscillators like RSI or stochastic, as well as volume and volatility tools, work well to confirm whether pullbacks into the ribbon are likely to continue the trend or lead to reversals.
6 Downloads
Published:
Dec 18, 2025 02:09 AM
Category: