Master Multi-Timeframe Trends: Ultimate Guide to Daily V3 Signal Dashboard
For intraday traders and scalpers, making trading decisions based on a single timeframe is one of the quickest ways to get trapped on the wrong side of the market. A sharp upward move on a 5-minute chart might look like a great buying opportunity, but if the hourly and daily trends are aggressively bearish, that minor rally is likely just a temporary retracement before a major sell-off.
To prevent these costly misalignments, professional traders use multi-timeframe analysis. However, constantly flipping back and forth between different chart windows can cause analysis paralysis. The Daily V3 Signal Dashboard indicator solves this problem by consolidating broad market conditions across multiple timeframes into a clean, compact HUD directly on your main chart.
What is the Daily V3 Signal Dashboard Indicator?
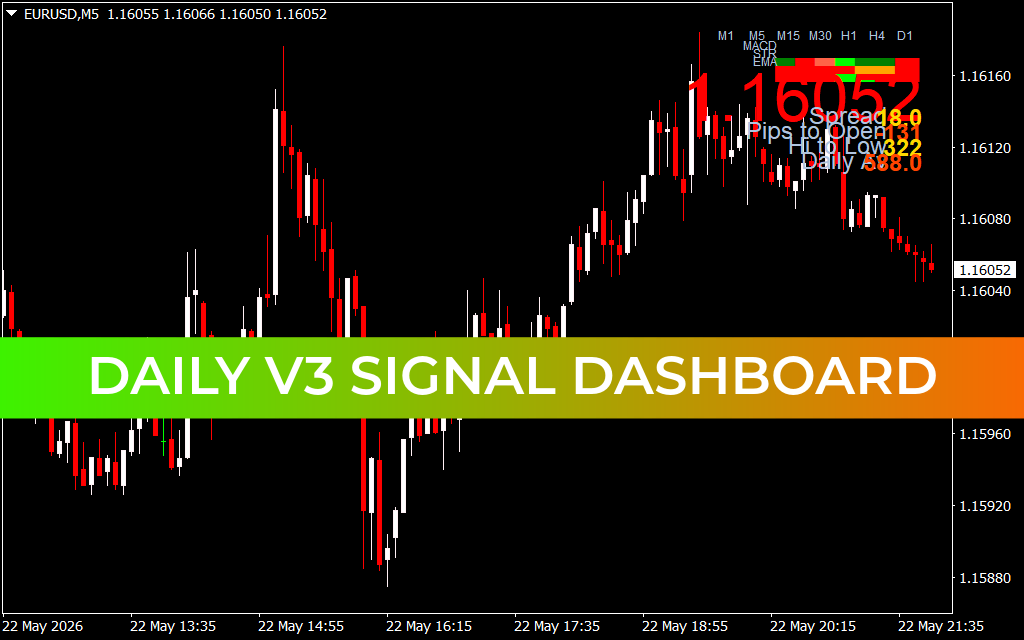
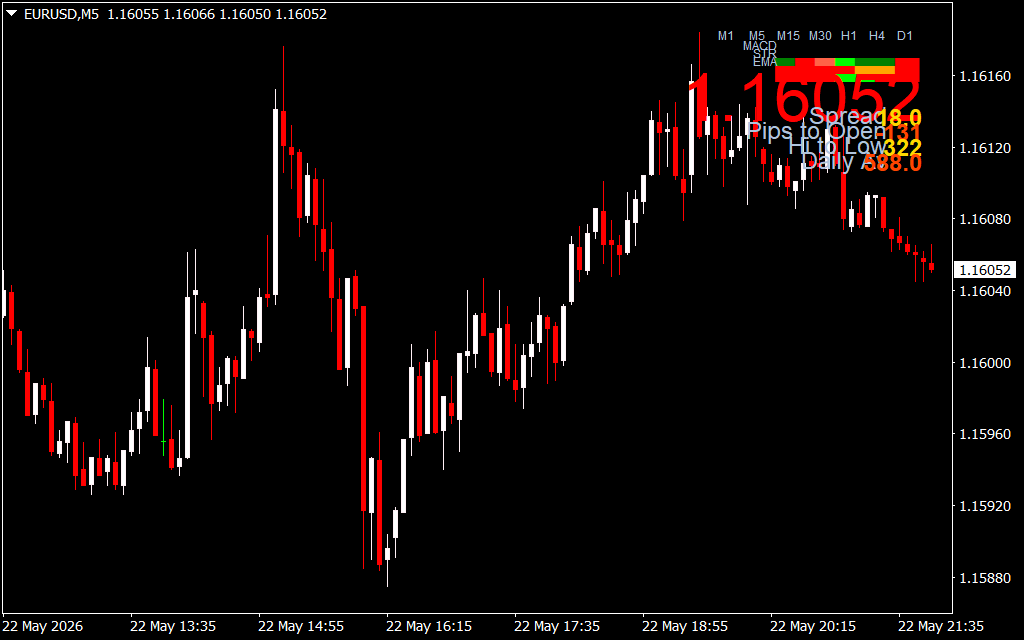
The Daily V3 Signal Dashboard is an advanced technical utility built to streamline market scanning. Instead of forcing you to open separate layouts for every time horizon, this powerful indicator runs complex algorithmic calculations in the background across various standard timeframes simultaneously—including the M1, M5, M15, M30, H1, H4, and D1 periods.
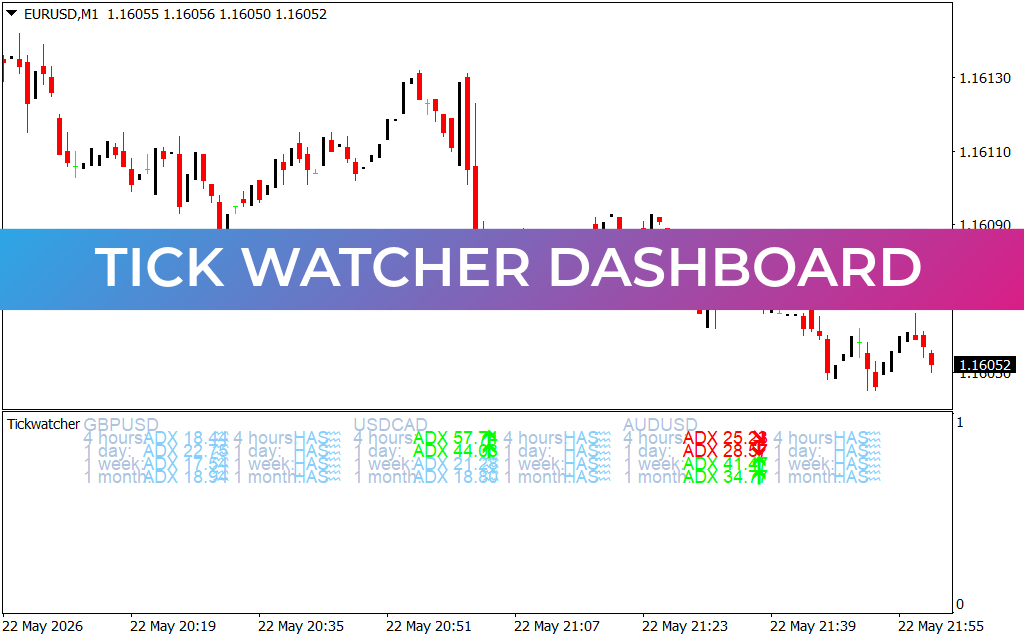
As demonstrated in the EUR/USD 5-minute (M5) chart above, the indicator displays a sleek, compact matrix dashboard in the upper-right corner. It cross-references multiple foundational technical criteria—such as the MACD momentum state, general trend structure (STR), and Exponential Moving Averages (EMA). The dashboard maps these states using clean, intuitive color codes: vibrant green squares indicate dominant bullish momentum, while bright red squares alert you to dominant bearish control.
Key Features and Strategic Advantages
- Multi-Timeframe Synchronization: Instantly monitor the trend direction from the 1-minute Scalping level up to the structural daily trend without leaving your current chart.
- Triple-Engine Confluence: The dashboard tracks MACD, core trend metrics, and EMAs simultaneously, ensuring you only take trades backed by true mathematical volume.
- Essential Live Market Data: Displays critical account and session statistics natively on the chart screen, including live Spread costs, Pips to Open, intraday high-to-low ranges, and overall daily progress.
- Clean, Non-Intrusive Interface: Designed to take up minimal chart space, keeping your main price action area completely clear of bulky lines or confusing oscillators.
How to Trade with Daily V3 Signal Dashboard
Integrating this multi-timeframe dashboard into an active execution system provides instant clarity:
- High-Probability Trend Alignment: Before entering a position, check the dashboard matrix for complete color harmony. For instance, if you are looking for a long (buy) entry on the M5 chart, look for the H1, H4, and D1 blocks to also show green. Trading in the direction of the dominant higher-timeframe trend significantly increases your win rate.
- Volatility and Spread Tracking: Utilize the built-in textual statistics to manage your risk. If the live Spread is abnormally high or the asset has already completed its average Daily range, it may be wiser to sit on your hands and wait for a fresh session open.
3 Downloads
Last Update:
May 24, 2026 02:48 AM
Published:
Jan 15, 2026 19:10 PM
Category: