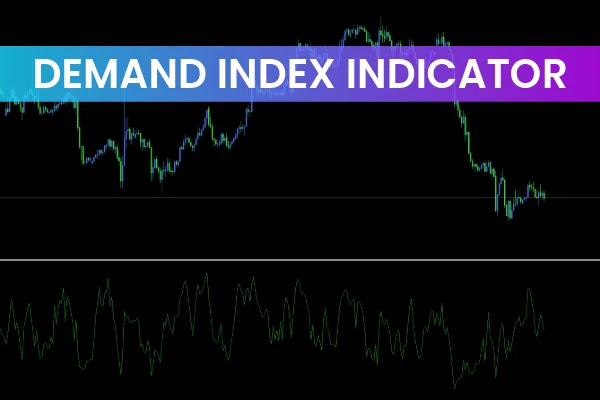
The Demand Index Indicator for MT5 by James Sibbet is a simple yet powerful momentum oscillator designed to track the balance between price movement and volume. Unlike traditional indicators that rely solely on price, the Demand Index combines volume data to measure true market strength.
Traders use the Demand Index Indicator to determine the market trend and potential reversal zones. Like other momentum oscillators, it helps identify overbought and oversold conditions. This makes it a valuable addition to any trader’s toolkit—especially for those who trade on MetaTrader 5 (MT5) platforms.
How the Demand Index Indicator Works
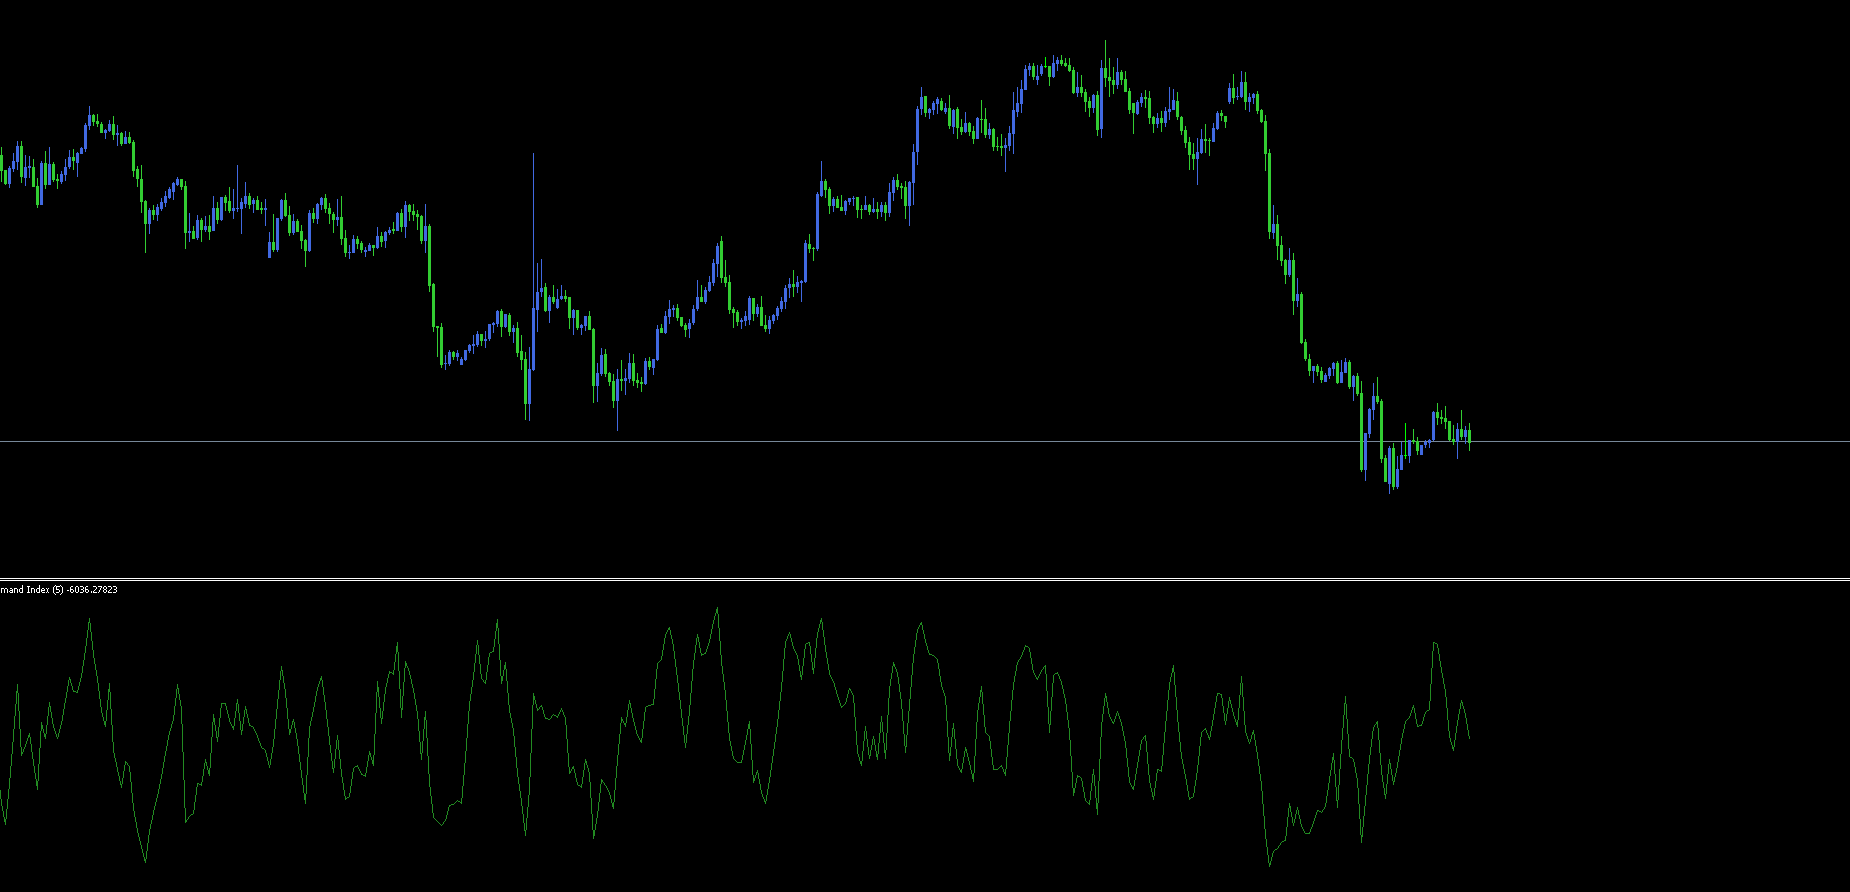
Unlike indicators such as the Relative Strength Index (RSI), which moves within a fixed scale of 0 to 100, the Demand Index fluctuates dynamically. It does not have strict boundaries because it reacts directly to market momentum and volume flow.
When market demand increases, the indicator line moves upward, signaling bullish strength. Conversely, when the demand drops, the line falls, signaling bearish momentum.
This makes it easier to spot early trend reversals before they appear on the price chart.
Best Timeframes and Settings
The Demand Index Indicator for MT5 can be used on any timeframe, from short-term intraday charts to long-term weekly charts. However, many traders find it performs best on H4 (4-hour) or daily timeframes, where market noise is reduced and trends are clearer.
You can adjust the sensitivity of the indicator depending on your strategy. For Scalping, use shorter periods; for swing trading, longer periods will provide smoother signals.
How to Identify Buy and Sell Signals
On an MT5 chart, the Demand Index plots a single signal line below the main price chart.
Buy Signal (Long Entry): When the signal line approaches the lower area, it indicates an oversold condition and a potential uptrend reversal. Traders may consider opening long positions here.
Sell Signal (Short Entry): When the signal line rises near its upper range, it signals an overbought condition and a possible downtrend. Traders may close long positions and open shorts.
To improve accuracy, traders often combine the Demand Index Indicator with confirmation tools such as the MACD or RSI. This multi-indicator approach reduces false signals and enhances trade reliability.
Practical Example on EUR/USD H4 Chart
For instance, on a EUR/USD H4 chart, when the indicator line touches the upper zone, it often predicts a short-term price reversal. Similarly, when it touches the lower zone, an uptrend may be approaching.
The simplicity of this visual signal makes the Demand Index Indicator for MT5 easy to use even for beginners.
Why Use the Demand Index Indicator?
Combines price and volume for better accuracy.
Detects hidden divergences not visible in Price Action.
Flexible for all timeframes and trading styles.
Free to download from trusted sources like IndicatorForest.com.
Whether you’re a professional trader or a beginner, the Demand Index can enhance your understanding of market dynamics and help you make informed decisions.
Conclusion & Call to Action
The Demand Index Indicator for MT5 by James Sibbet is an excellent tool for identifying overbought and oversold zones, trend reversals, and momentum shifts. Its single-line simplicity makes it ideal for traders who prefer clarity without clutter.
👉 Download the Demand Index Indicator for MT5 for free at IndicatorForest.com and start improving your trading analysis today!
For more advanced tools, check out our Momentum Indicators Collection to complement your strategy.
Published:
Nov 01, 2025 06:15 AM
Category: