Master Dynamic Breakouts with the Sidus Indicator for MT5
In the modern trading landscape, simplicity often outweighs complexity. Traders are frequently overwhelmed by cluttered charts and conflicting signals. The Sidus Indicator for MetaTrader 5 (MT5) stands out as a premier solution for those seeking a streamlined, visual-first approach to capturing explosive trend reversals and sustained market momentum. By utilizing a proprietary blend of moving average crossovers and volatility ribbons, Sidus offers a comprehensive "all-in-one" system that identifies high-probability entry and exit points with surgical precision.
Download Sidus Indicator for free. Capture high-probability trend reversals on MT5 with clear signal arrows and dynamic volatility ribbons. Trade better.
The Anatomy of the Sidus System
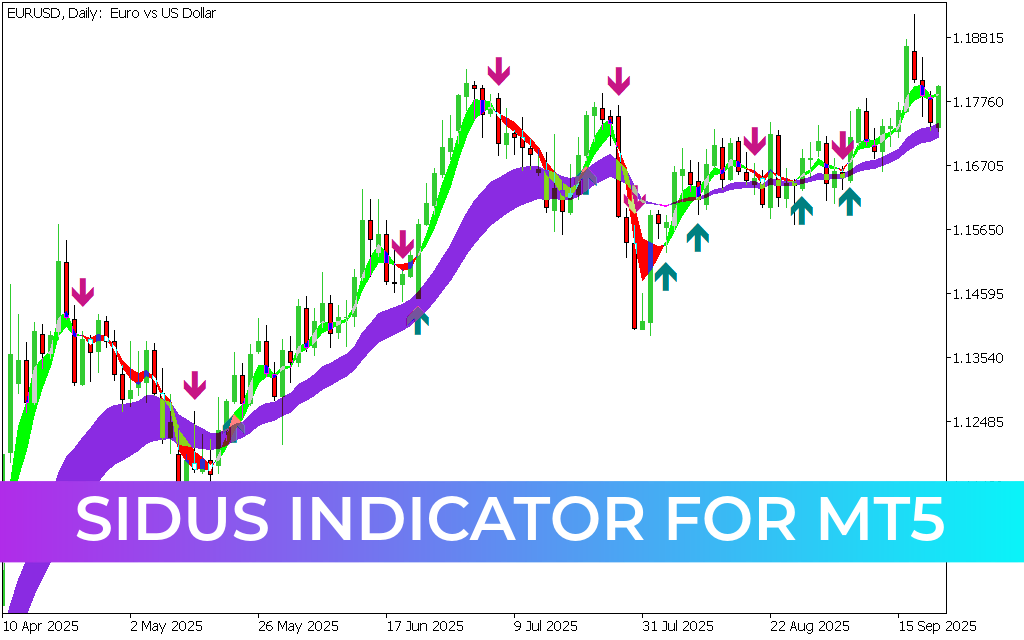
The Sidus methodology is built upon the interaction between fast-moving averages and a slow-moving baseline, typically visualized as a dynamic "ribbon." As demonstrated in the EURUSD Daily chart, the indicator creates a distinct visual environment:
- The Volatility Ribbon: The purple-shaded area represents the core value zone. When Price Action is above this ribbon, the market is in a confirmed bullish phase; when below, the bears are in control.
- The Trend Clouds: The indicator features green and red shaded areas (clouds) that form at the intersection of the moving averages. A green cloud signifies a transition into bullish territory, while a red cloud marks a bearish shift.
- Signal Arrows: To further simplify execution, the Sidus system overlays teal "up" arrows and magenta "down" arrows exactly where the trend alignment is mathematically confirmed.
Why Sidus is Essential for MT5 Traders
MetaTrader 5 is known for its advanced analytical capabilities, and the Sidus indicator leverages this power to provide a lag-reduced experience. Here is why it belongs in your trading toolkit:
- Objective Entry Points: Trading is often plagued by hesitation. Sidus removes the emotional burden by providing clear, arrow-based signals. When the ribbon flips color and an arrow appears, the statistical edge is confirmed.
- Dynamic Support And Resistance: The purple ribbon acts as a "moving floor" or "moving ceiling." In a strong trend, price will often pull back to the edge of the ribbon before continuing its original path, offering secondary entry opportunities for disciplined traders.
- Visual Sentiment Analysis: At a single glance, you can determine the market's health. The width of the ribbon indicates the strength of the trend—a widening ribbon suggests accelerating momentum, while a narrowing ribbon warns of a potential consolidation or reversal.
- Optimized for All Timeframes: Whether you are an intraday scalper looking for small pulses or a swing trader targeting major daily shifts, the Sidus algorithm adapts its sensitivity to provide relevant data for your specific style.
Strategic Implementation
The most powerful way to trade the Sidus Indicator is by Trend Alignment. In the provided daily chart, notice how a teal arrow on May 2nd preceded a massive upward expansion. By staying in the trade as long as the price remained above the purple ribbon, a trader could have captured the majority of the "meat" of that move.
Additionally, Sidus is an excellent tool for managing Stop-Losses. By placing your stop-loss on the opposite side of the purple ribbon, you ensure that you are only exited from the trade if the underlying trend has officially failed.
Conclusion
The Sidus Indicator for MT5 represents the perfect marriage of mathematical crossover logic and modern visual design. It provides the clarity needed to navigate volatile markets without the noise of traditional oscillators. Download the Sidus Indicator today and start identifying the markets' most profitable breakouts with absolute confidence.
10 Downloads
Last Update:
May 08, 2026 01:34 AM
Published:
Jan 26, 2026 12:58 PM
Category: