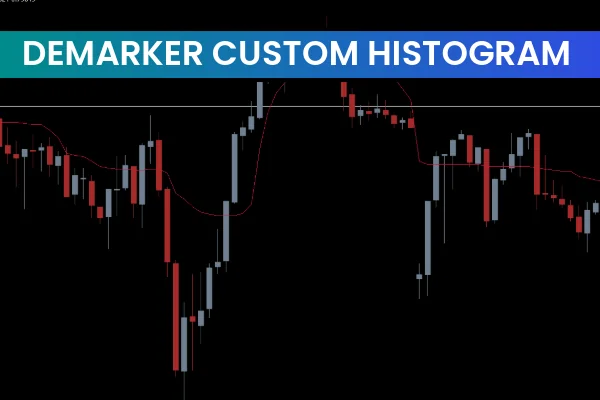
The Demarker Custom Histogram indicator is a popular and useful Forex Indicator that is compatible with the MetaTrader 4 platform. This indicator is widely used by traders to analyze market trends and make informed trading decisions. The Demarker Custom Histogram indicator is free to download and easy to use.
This indicator works by plotting a histogram based on the Demarker indicator, which measures the rate of change in price movement. Traders can use this histogram to identify overbought and oversold conditions in the market, as well as potential trend reversals. By understanding these market dynamics, traders can better time their entries and exits for more profitable trades.
Traders can use the Demarker Custom Histogram indicator by downloading it onto their MT4 platform and applying it to their chart. The indicator settings can be customized to suit individual trading styles and preferences. With its user-friendly interface and accurate analysis, this indicator is a valuable tool for forex traders.
Why Choose Demarker Custom Histogram Indicator?
Plots a clear histogram based on the Demarker indicator
Helps identify overbought and oversold market conditions
Signals potential trend reversals for better trade timing
Supports all major currency pairs and multiple timeframes
Free and easy to install on MT4
By using the Demarker Custom Histogram indicator, traders can gain a clearer understanding of market dynamics, reduce guesswork, and make more informed trading decisions.
How to Use Demarker Custom Histogram Indicator
Installation and Setup
Download the Demarker Custom Histogram indicator for free.
Install it on your MT4 platform.
Attach it to the desired chart and timeframe.
Customize the settings to match your trading strategy.
Trading Signals
Overbought Condition: Histogram indicates overbought levels, signaling a potential market reversal.
Oversold Condition: Histogram shows oversold levels, providing potential buying opportunities.
Trend Reversal: Changes in histogram direction can help anticipate market reversals for better trade timing.
Example
On the EUR/USD H1 chart, the Demarker Custom Histogram shows the histogram reaching the overbought level, signaling a possible bearish reversal. Conversely, when the histogram reaches the oversold level, it may indicate a bullish reversal, providing opportunities to enter long positions.
Advantages of Demarker Custom Histogram Indicator
Provides accurate analysis of overbought and oversold conditions
Helps identify potential trend reversals early
Suitable for all currency pairs and multiple timeframes
Free to download and user-friendly for MT4 traders
Improves trading decisions and risk management
By incorporating the Demarker Custom Histogram indicator into their trading routine, traders can enhance accuracy, anticipate market changes, and optimize overall trading performance.
Conclusion
The Demarker Custom Histogram Indicator MT4 is an essential tool for forex traders who want to analyze market trends and identify potential trade opportunities. By plotting a histogram based on the Demarker indicator, traders can better understand overbought/oversold conditions and trend reversals. Visit IndicatorForest.com to download the Demarker Custom Histogram indicator for free and improve your MT4 trading today.
FAQ
Demarker Custom Histogram plots a histogram based on the Demarker indicator, which measures the rate of change in price movement. It helps identify overbought and oversold conditions in the market, as well as potential trend reversals, by visualizing momentum changes in histogram format.
When the histogram reaches high levels, it indicates overbought conditions, signaling a potential market reversal downward. When the histogram reaches low levels, it shows oversold conditions, providing potential buying opportunities as price may reverse upward.
Yes, changes in histogram direction can help anticipate market reversals. When the histogram reaches extreme levels and begins to reverse, it may signal that the current trend is losing momentum and a reversal could be developing, helping traders time entries and exits better.
Yes, traders can customize the indicator settings to suit individual trading styles and preferences. You can adjust the Demarker period, histogram sensitivity, and visual display options to match your trading strategy and risk tolerance.
Combine Demarker Histogram with trend indicators, support/resistance levels, or price action patterns for confirmation. Extreme histogram readings near key price levels typically provide stronger reversal signals than histogram extremes alone.
Published:
Dec 16, 2025 02:53 AM
Category: