Master Market Predictions with the Forecasting Price Ranges Indicator
In the highly volatile world of Forex and CFD trading, the ability to anticipate where price is headed—and, more importantly, where it is likely to stop—is the ultimate edge. While many indicators focus on the past, the Forecasting Price Ranges Indicator for MetaTrader 4 and 5 is designed to look forward. By utilizing advanced statistical modeling and historical volatility data, this tool provides traders with a visual roadmap of potential price boundaries, allowing for precision entries and institutional-grade exit planning.
What is the Forecasting Price Ranges Indicator?
The Forecasting Price Ranges indicator is a sophisticated volatility-based tool that calculates the most probable trading zones for any given session. Unlike standard Support And Resistance lines that remain static, these forecasting ranges are dynamic. They adjust in real-time based on the current market environment, providing a "probability envelope" that price is statistically likely to stay within.
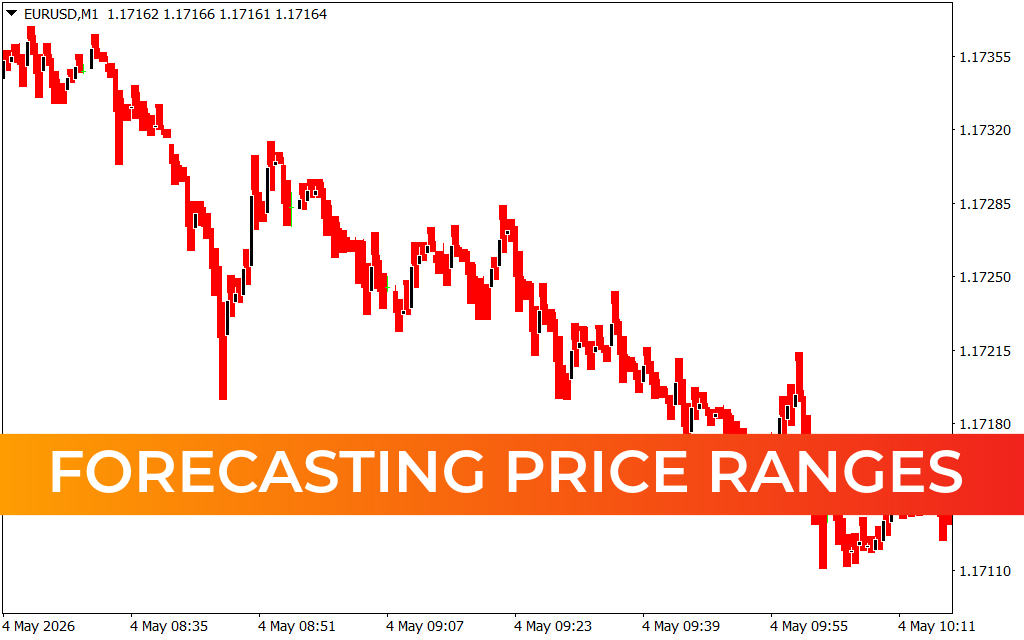
As seen in the provided EUR/USD M1 chart, the indicator projects clear horizontal levels:
- Target Resistance Zones (Red Dots): These upper boundaries represent areas where price is statistically overextended. These are ideal zones for profit-taking or identifying potential reversal points for short positions.
- Target Support Zones (Blue Dots): These lower boundaries mark areas where the market is considered "oversold" relative to its recent volatility. Traders look to these levels for high-probability "buy the dip" opportunities.
Trading with Statistical Probability
The true power of this indicator lies in its ability to quantify market risk. Most retail traders fail because they enter trades in the "middle" of a range where the risk-to-reward ratio is unfavorable. The Forecasting Price Ranges Indicator solves this by identifying the extremes.
- Trend Confirmation: If price is consistently hugging the upper forecasting range during an uptrend, it confirms strong bullish momentum.
- Mean Reversion: When price touches the outer red or blue dots and then begins to curve back toward the center, it signals a high-probability mean reversion trade.
- Breakout Detection: If price decisively breaks and closes outside the forecasted range, it often signals a volatility expansion, warning the trader that a major new trend is beginning.
Why Every Professional MetaTrader User Needs This
Whether you are a scalper on the 1-minute chart or a swing trader on the daily timeframe, knowing the "expected range" of a move is vital. This indicator removes the guesswork. It tells you exactly where the "walls" are located, allowing you to set tighter stop-losses and more realistic take-profit targets.
By automating the calculation of volatility-adjusted ranges, the Forecasting Price Ranges tool ensures that your strategy is always aligned with current market conditions. It is particularly effective during high-impact news events when standard technical analysis often fails.
Conclusion
The Forecasting Price Ranges Indicator is an essential upgrade for any serious trader. It transforms your chart from a chaotic series of candles into a structured map of statistical probability. Download it today to enhance your MT4/MT5 setup, reduce your risk, and start forecasting your trades with professional-level accuracy.
2 Downloads
Last Update:
May 04, 2026 15:02 PM
Published:
Jan 28, 2026 02:20 AM
Category: