Simplify Volatility Envelopes: DF Donchian Fibo Indicator for MT4
Isolating objective value areas in fast-moving liquid markets like the 15-minute (M15) chart requires an ironclad visual framework. For day traders and scalp operators, trying to manually map historical breakout channels alongside mathematical Fibonacci retracements can create a cluttered charting template, resulting in execution delays. The DF Donchian Fibo Indicator for MT4 addresses this operational roadblock by fusing classic Donchian pricing bands with structural Fibonacci levels into a single dynamic overlay on your platform.
Unveiling the Geometric Convergence of Donchian and Fibonacci
The operational concept behind the DF Donchian Fibo framework relies on capturing physical price extensions and calculating mathematical equilibrium zones. Standard Donchian Channels simply map the absolute highest high and lowest low over a set tracking period, acting as an excellent gauge for traditional breakout momentum. However, they lack internal structural reference points to guide pullbacks or scale-ins.
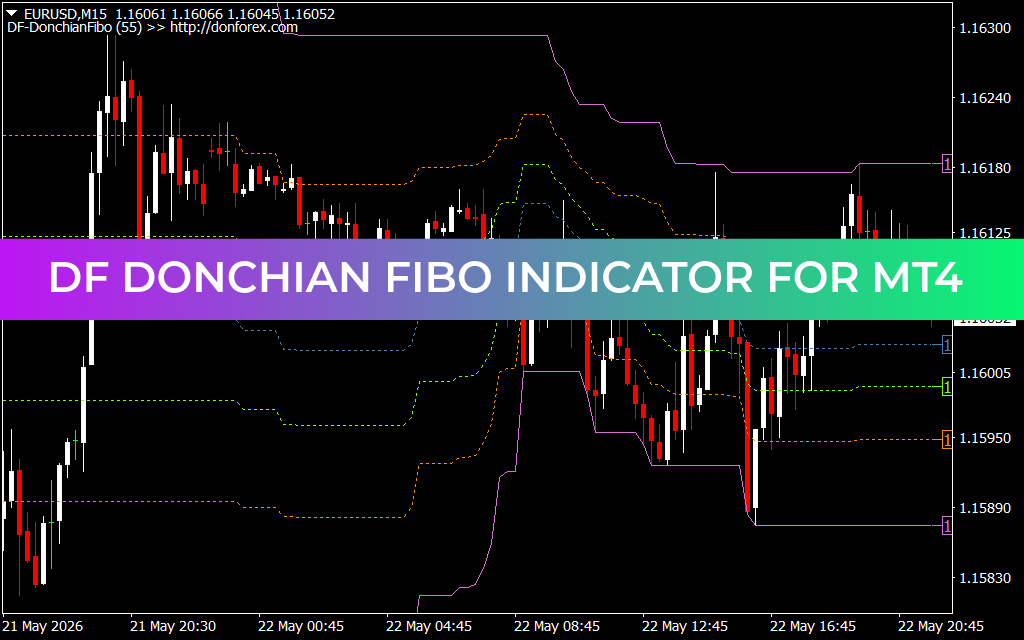
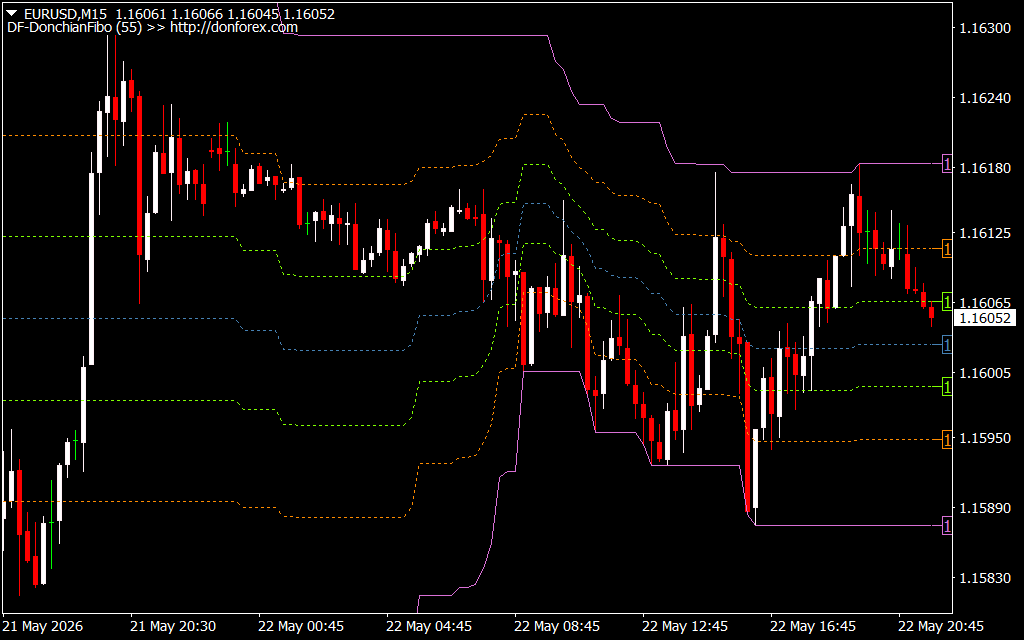
This modified indicator upgrades the classic model by processing hidden Fibonacci breakdown ratios between the upper and lower channel boundaries. When loaded onto a liquid workspace like the EUR/USD pair, it organizes price geometry into key horizontal bands:
- The Outer Channels (Dotted Boundaries): Track the true rolling volatility limits of the current session, highlighting extreme premiums (overhead resistance) and heavy discount zones (underlying support).
- The Internal Fibo Matrix (Multi-Colored Dashed Horizons): Plots key percentage retracements between the channel extremes. These interior thresholds represent mathematical value pockets where institutional market makers routinely re-accumulate or distribute inventory during a minor counter-trend correction.
By combining these two distinct disciplines, the script allows technical analysts to view critical price boundaries without overcrowding the workspace with manual drawing tools.
Tactical Trade Execution Models on the EUR/USD Workspace
During active trading session crosses, major currency pairs cycle continuously between range-bound compressions and violent trend legs. On the M15 chart layout, a sharp institutional volume impulse can push prices violently out of a horizontal range, forcing the outer channel bands to stretch upward or downward.
Systematic market operators can use this integrated band matrix to manage two core strategies:
- Fibonacci Pullback Re-Entries: When a dominant bullish trend expands the upper dotted channel band, avoid chasing the breakout. Instead, wait for a minor corrective pullback into the internal dashed Fibonacci levels (such as the median fair value zone). If price prints a clean rejection candle at these internal lines, it confirms a high-probability value entry aligned with the master expansion.
- Dynamic Trailing Target Execution: Use the opposite outer channel boundaries as automated profit-taking targets. For instance, entering a short position near an internal premium line allows you to trail your position objectively down toward the lower dotted support floor, securing clear mathematical exit targets.
Core Architecture Features for Technical Specialists
- Automated Multi-Layer Computation: Instantly plots rolling channel extremes and hidden Fibonacci metrics simultaneously, eliminating manual calculation errors.
- Clutter-Free Visual Blueprint: Renders clean, thin dashed lines directly over your asset candlesticks, making it perfectly compatible with layered volume profiles or order block indicators.
- Responsive Multi-Timeframe Integration: Highly reactive on lower micro-Scalping horizons like the M1 and M5 screens, while providing rock-solid structural parameters on macro H1 and H4 swing charts.
The DF Donchian Fibo Indicator functions as an indispensable analytical map, cutting through raw lower-timeframe market noise to equip retail traders w
2 Downloads
Last Update:
May 23, 2026 02:21 AM
Published:
Jan 16, 2026 09:10 AM
Category: